I would ideally like to create a bit of panic here by showcasing a potential trendline shakeout of the ascending triangle/wedge. To aid and assist the T20 Market Manipulation I have pointed out reasoning's for them to hit some stop losses. If my thesis pans correct we should see large volume into the bids as T20 continue adding size at key support levels to drop their averages.
Any trendline shakeouts would signal the news pump within 48hrs of them shaking the tree. Possible Friday moves? We wait and see as I make my predictions ahead of time (not a hindsighter)
Insiders will also partake in the S.P.P so this just means ALL A MATTER OF TIME for a massive supernova run again. A clearing of 10c easily puts 15c into targets. Lots of upside. Let's just wait for their PUMP NEWS to come shortly.
Question is will I get a chance to add more to my position? I have a measly 10,000 at 7.1c and want this trendline shakeout as I would ideally like 50,000 units total I think I'm down like -$40 here lol
NOTE:
The silly Top 20 Capping of SMALL UNITS all so that the BIG BIDS get hit HAHAHAHAHA I'll risk $200 here to make $1,000 with the big boyz
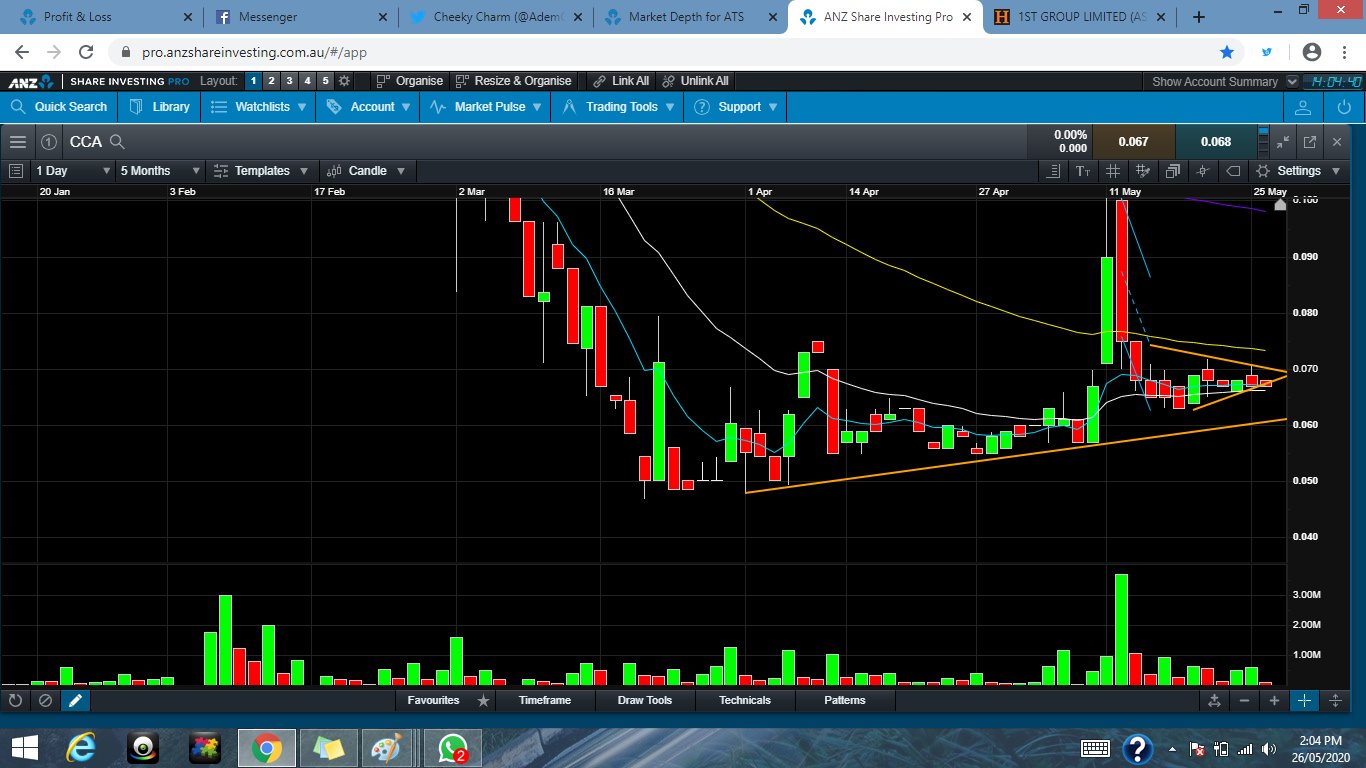
CCA Chart


Add CCA (ASX) to my watchlist
 (20min delay) (20min delay)
|
|||||
|
Last
6.1¢ |
Change
0.000(0.00%) |
Mkt cap ! $38.28M | |||
| Open | High | Low | Value | Volume |
| 6.1¢ | 6.2¢ | 6.1¢ | $4.797K | 78.63K |
Buyers (Bids)
| No. | Vol. | Price($) |
|---|---|---|
| 1 | 164807 | 5.5¢ |
Sellers (Offers)
| Price($) | Vol. | No. |
|---|---|---|
| 6.3¢ | 15000 | 1 |
View Market Depth
| Last trade - 15.41pm 03/05/2024 (20 minute delay) ? |

|
|||||
|
Last
6.1¢ |
Change
0.000 ( 0.00 %) |
||||
| Open | High | Low | Volume | ||
| 6.1¢ | 6.1¢ | 6.1¢ | 2300 | ||
| Last updated 15.41pm 03/05/2024 ? | |||||
| CCA (ASX) Chart |