The article below came into my inbox overnight and looks at the now widening deficit for copper in 2024.
Cheers...........D
********************************************************************************
5 structural drivers of surging copper demand and 9 ways to invest
7TH MAY, 24
Nick Pashias
Antares Equities
In an era where the world is increasingly reliant on electricity, copper emerges as a critical component in meeting the surging demand. As the backbone of power infrastructure and a key enabler of technological advancements such as Electric Vehicles (EV), artificial intelligence (AI) and data centres, copper stands at the forefront of the energy revolution. This paper explores the compelling reasons why copper presents an attractive opportunity for investors seeking exposure to the evolving landscape of power consumption.
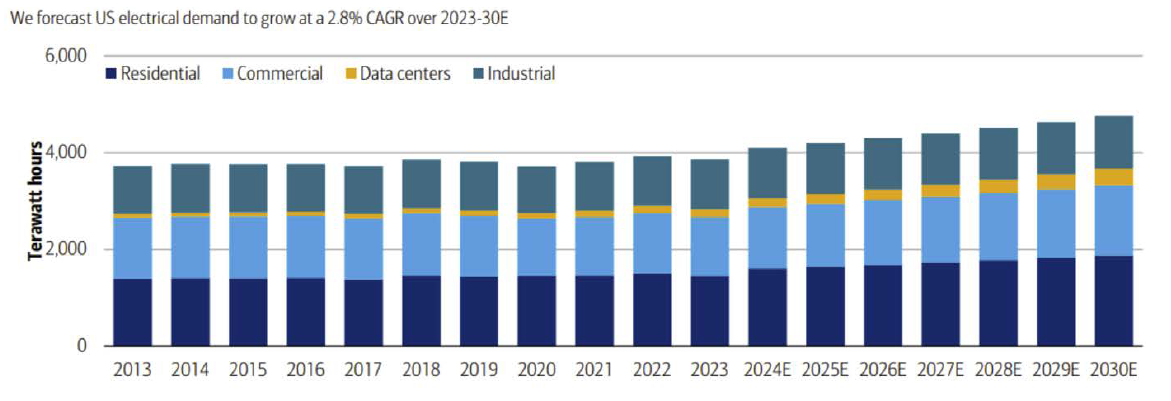
Unprecedented growth in power demand: Electricity consumption is experiencing an unprecedented surge, driven by various factors including the electrification of transportation and buildings, and the proliferation of data centres. Notably, data centre demand alone is forecast to grow by an average of 11% annually until 2030, reflecting the increasing reliance on digital infrastructure. Below is an example, from BofA Research, of the expected growth in US power demand.
Figure 1: US Electrical demand (terawatts per year)
Source: BofAGlobal Research, US Energy Information Administration; 2024
For the last 10 years (2013-2023) US electrical load growth averaged 0.4%pa.– a modest amount, as US manufacturing was relocated to low cost geographies and energy efficiency more than offset the take-up of consumer goods. However, with the development of new technologies this is now forecast to grow by 2.8% pa over the next seven years, driven by data centres, EV adoption and building electrification. Building electrification involves the replacement of gas as the energy source for space and water heating, an incentive structure which exists under the Inflation Reduction Act (IRA).
Data centres and AI: Data centres, fuelled by the AI boom, have become the fastest-growing consumers of power. As AI applications continue to evolve, the demand for data processing and storage escalates, placing significant strain on power grids worldwide. With data centres increasingly adopting AI technologies, the need for robust power infrastructure, including copper-based systems, becomes indispensable.
Although data centres currently consume around 1-2% of total electricity production (according to the International Energy Agency) the median of 46 separate forecasts by Mytton and Ashtine suggests data centre energy usage will grow at 11% pa through 2030.
According to Nick Snowdon of Goldman Sachs (GS), the key link is the copper requirements tied to the data centres to support AI growth. GS estimate that 1GW of data centre capacity requires between 40-60kt of copper. Estimates vary on planned US additions but a rough estimate is to add ~8GW in 2024, 12 GW in 25 and 16GW in 2026, after 3GW in 2023. In copper volumes that means ~200kt of demand in 23 in the US then as much 400-500kt in 24.
Supply constraints and market dynamics: Despite the rising demand, the supply of copper faces challenges, with production shortfalls and disruptions becoming increasingly prevalent. Factors such as geopolitics, production halts, delays, and aging mines contribute to a tightening supply-demand imbalance, amplifying the attractiveness of copper as an investment opportunity.
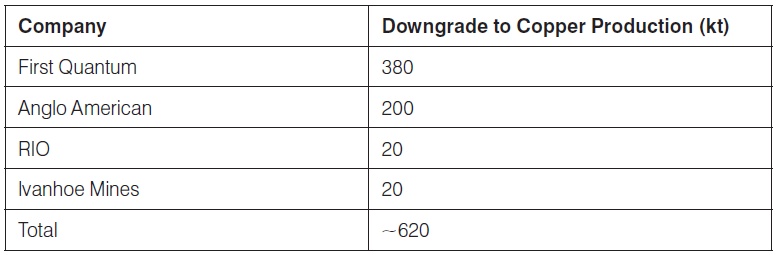
Over the last few quarters, for various reasons, a number of the worlds premier copper producers have cut copper production guidance or missed production targets, the table below provides our estimate of the production lost.
In aggregate they add up to a significant quantum ~620kt in a market of ~25mtpa (~2.5%).
Table 1: Recent downgrades to global copper production
Source: Bloomberg, Antares Equities; April 2024
Technological advancements and infrastructure upgrades:
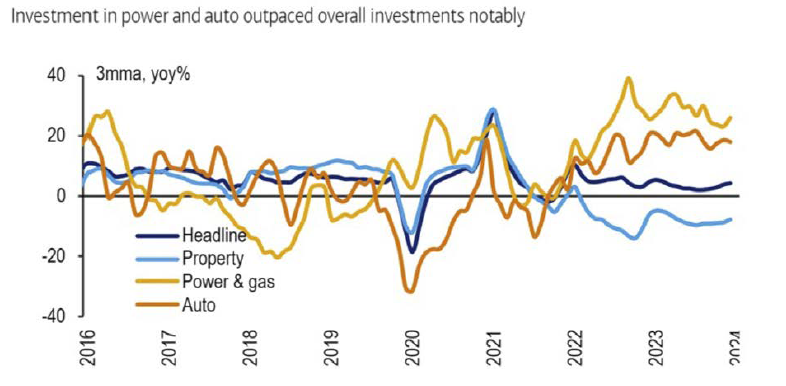
Its no secret that over the last several years China has pivoted away from its traditional source of growth, being property development, to higher value add sectors such as auto, solar cells and wind turbines. This is best illustrated by the chart below that shows the bifurcation between the new and old sectors in terms of fixed asset investment.
Figure 2: Chinese fixed asset investment (FAI) by sector
Source: BofA Global Research, CEIC, NBS; 2024
Traditional analysis that looks only at property may yield the wrong conclusion that China’s demand for commodities is reducing. But a more wholistic perspective shows that investment continues at pace in other sectors that are less steel intensive but perhaps more base metal intensive, ie copper.
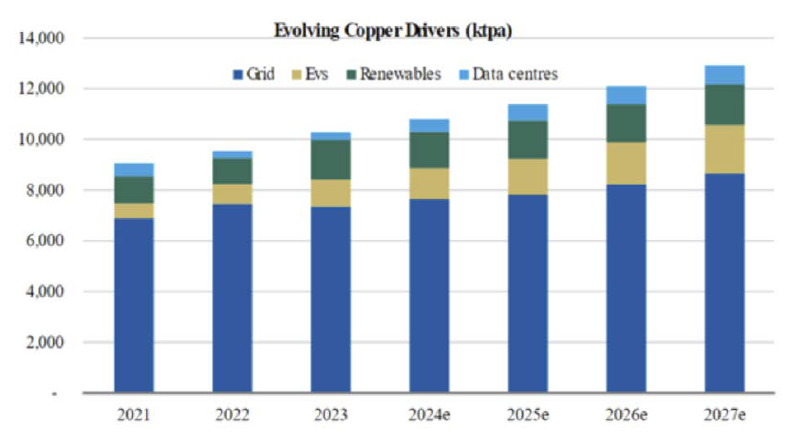
While Chinese grid demand is expected to continue growing it is when the mega-trends of decarbonisation and AI are overlayed that demand for copper takes another surge higher.
Figure 3: Evolving drivers of copper demand
Data centres could account for 1.5-3.3% of copper usage by 2027e, versus EV's at 5.2%
Source: Woodmac, Morgan Stanley Research; 2024
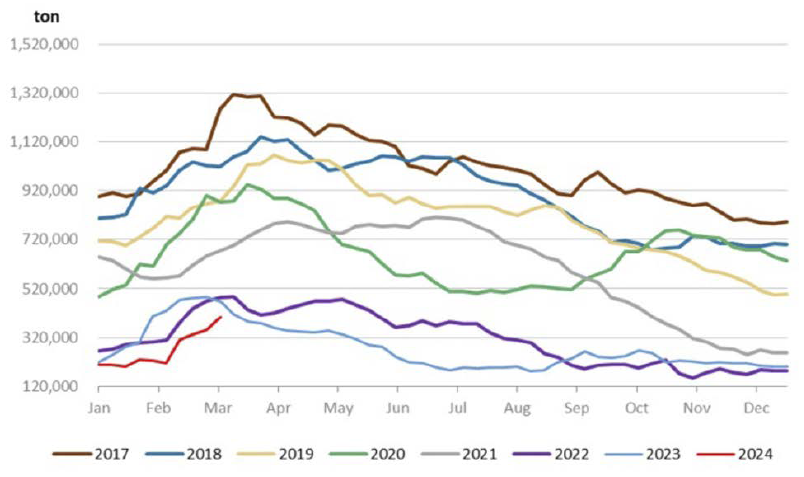
Inventory
Perhaps a simple chart is best when trying to describe the current state of global copper inventory. Over the last 8 years inventories in March have never been this low.
Figure 4: Apparent copper inventory (LME, SHFE, Shanghai Bonded)
Source: Bloomberg, Morgan Stanley, Antares Equities; April 2024
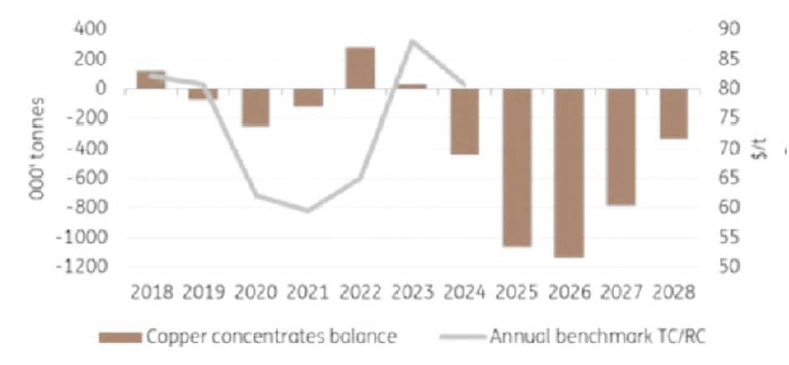
Putting it all together
A few months ago, looking at supply and demand models would have shown a modest surplus of a few hundred thousand tonnes in 2024 before moving into a modest deficit over the 25/26 period. This has now changed.
The missing supply of ~620kt coupled with higher demand (not only from the structural drivers spoken about here but also from the cyclical upswing in growth the world seems to be enjoying currently) have come together sooner than expected. 2024 is now expected to be a meaningful deficit.
Figure 5: Copper concentrate deficit forecasts
Copper concentrates deficit continues to grow
Source: CRU, Fastmarkets, ING Research; 2024
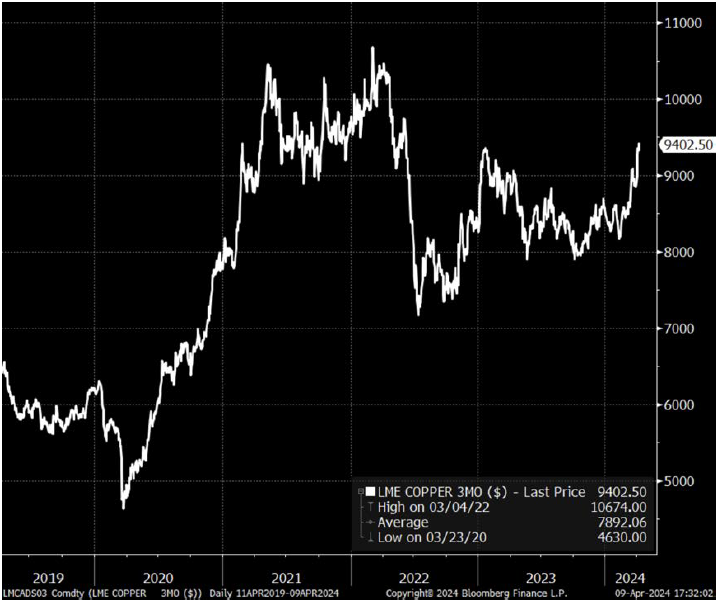
Of course, this deficit comes at a time of low inventory buffer which implies that should deficits occur, elevated pricing that is well above the cost curve may be needed to bring the market back into balance.
Figure 6: Copper price (USD per ton)
Source: Bloomberg, Antares Equities; April 2024
Conclusion
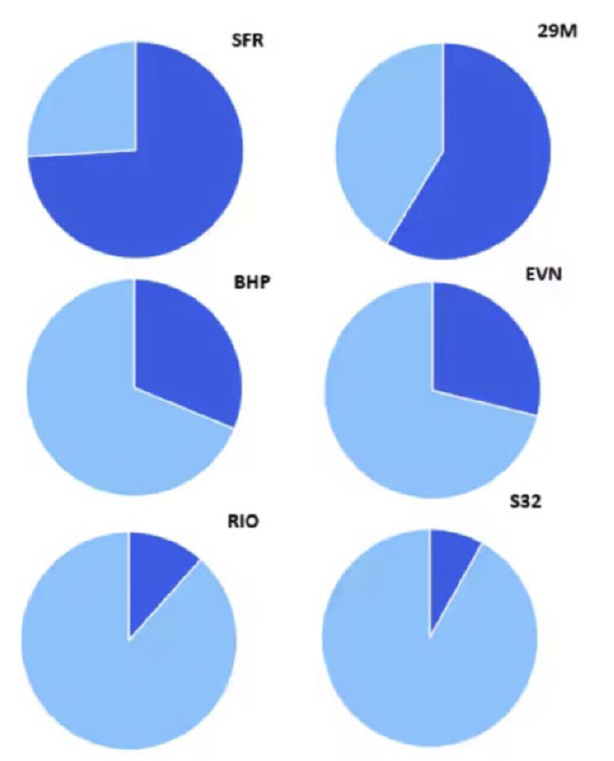
Historically, Australia has hosted only a handful of sufficiently liquid copper producers listed on its stock exchange. Below, we present a concise overview of some prominent players and their approximate copper revenue exposure (dark blue indicates copper revenue). Additionally, there are a few other ways to gain exposure:
Metals Acquisition Corp (ASX: MAC) and Capstone Copper (ASX: CSC): Recent entrants to the Australian Securities Exchange (ASX), these companies have sought to address the pent-up demand from investors seeking exposure to the copper market.
Sims (ASX: SGM): A noteworthy presence, Sims is a global leader in recycling, dealing with both ferrous and non-ferrous materials such as copper and aluminium.
Small Developers and Explorers: In addition to established players, there exists a number of smaller developers and explorers poised to capitalise on the prevailing market sentiment surrounding copper.
Figure 7: 2024 Est. exposure to copper as a percentage of revenue
Source: Citi; Research; April 2024
The article below came into my inbox overnight and looks at the...


Add AIS (ASX) to my watchlist
 (20min delay) (20min delay)
|
|||||
|
Last
28.0¢ |
Change
-0.015(5.08%) |
Mkt cap ! $270.9M | |||
| Open | High | Low | Value | Volume |
| 29.0¢ | 29.5¢ | 27.5¢ | $1.158M | 4.101M |
Buyers (Bids)
| No. | Vol. | Price($) |
|---|---|---|
| 12 | 508855 | 28.0¢ |
Sellers (Offers)
| Price($) | Vol. | No. |
|---|---|---|
| 28.5¢ | 107228 | 4 |
View Market Depth
| Last trade - 16.10pm 24/05/2024 (20 minute delay) ? |

|
|||||
|
Last
28.0¢ |
Change
-0.015 ( 5.02 %) |
||||
| Open | High | Low | Volume | ||
| 29.0¢ | 29.0¢ | 27.5¢ | 2593462 | ||
| Last updated 15.59pm 24/05/2024 ? | |||||
| AIS (ASX) Chart |