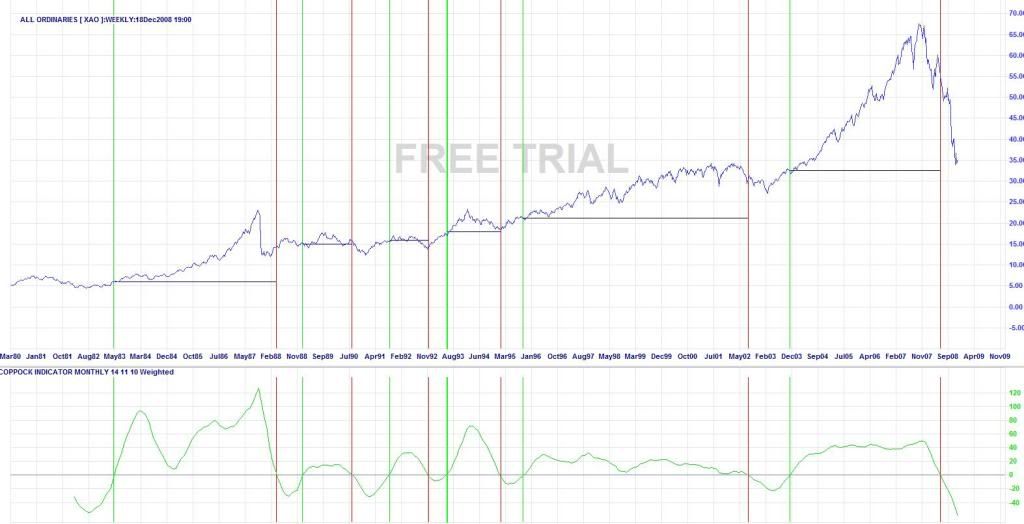
Here is the Coppock indicator from the last 28 yrs on the XAO. (sorry the graph is a bit faded, not sure what happened)
"A bull market is signaled when the Coppock Indicator turns up from below zero."
http://www.incrediblecharts.com/technical/coppock_indicator.php
"The indicator is trend-following, and based on averages, so by its nature it doesn't pick a market bottom, but rather shows when a rally has become established."
http://en.wikipedia.org/wiki/Coppock_curve
So for people not wanting to pick the bottom, but are waiting till the market enters its next bull stage (might be a while though!) this could be one to look out for.
I added in the green and red lines to signify the 0 crossover on the coppock Indicator. Although it is not suppose to generate sell signals, I added lines just to show how if you bought when it turned from negative to positive, and sold when it went back below zero, the last 5 out of 6 signals would have provided profits. That being said, all of the buy signals would have had an opportunity to sell for a profit at some time before it crossed below zero anyway.
What does everyone else think of this indicator?
- Forums
- ASX - By Stock
- XJO
- coppock indicator
coppock indicator
-
- There are more pages in this discussion • 6 more messages in this thread...
You’re viewing a single post only. To view the entire thread just sign in or Join Now (FREE)
Featured News
Add XJO (ASX) to my watchlist
 (20min delay) (20min delay)
|
|||||
|
Last
7,665.6 |
Change
-101.100(1.30%) |
Mkt cap ! n/a | |||
| Open | High | Low |
| 7,766.7 | 7,766.7 | 7,660.9 |
Featured News
| XJO (ASX) Chart |
The Watchlist
AHK
ARK MINES LIMITED
Ben Emery, Executive Director
Ben Emery
Executive Director
Previous Video
Next Video
SPONSORED BY The Market Online


