Australian property demand influenced by migration! best plan is to pick the location of your accommodation if you can do that with employment!
https://www.therealestateconversation.com.au/news/2024/04/26/the-biggest-migration-hot-spots-and-the-impact-housing-trends-corelogic/1714087511Apr 26, 2024The biggest migration hot spots and the impact on housing trends - Corelogic
By Eliza Owen Head of Research Corelogic Australia.
Australia is slowly moving through an enormous (though temporary) spike in overseas migration. The ABS reports Australia’s population increased 2.5%, or 660,000, in the year to September 2023. Its latest regional migration data reveals the areas with the highest migration levels through the 2022-23 financial year (FY23). This has been driven by a combination of internal migration (movement from one part of Australia to another) and overseas migration (arrivals and departures between Australia and other countries).
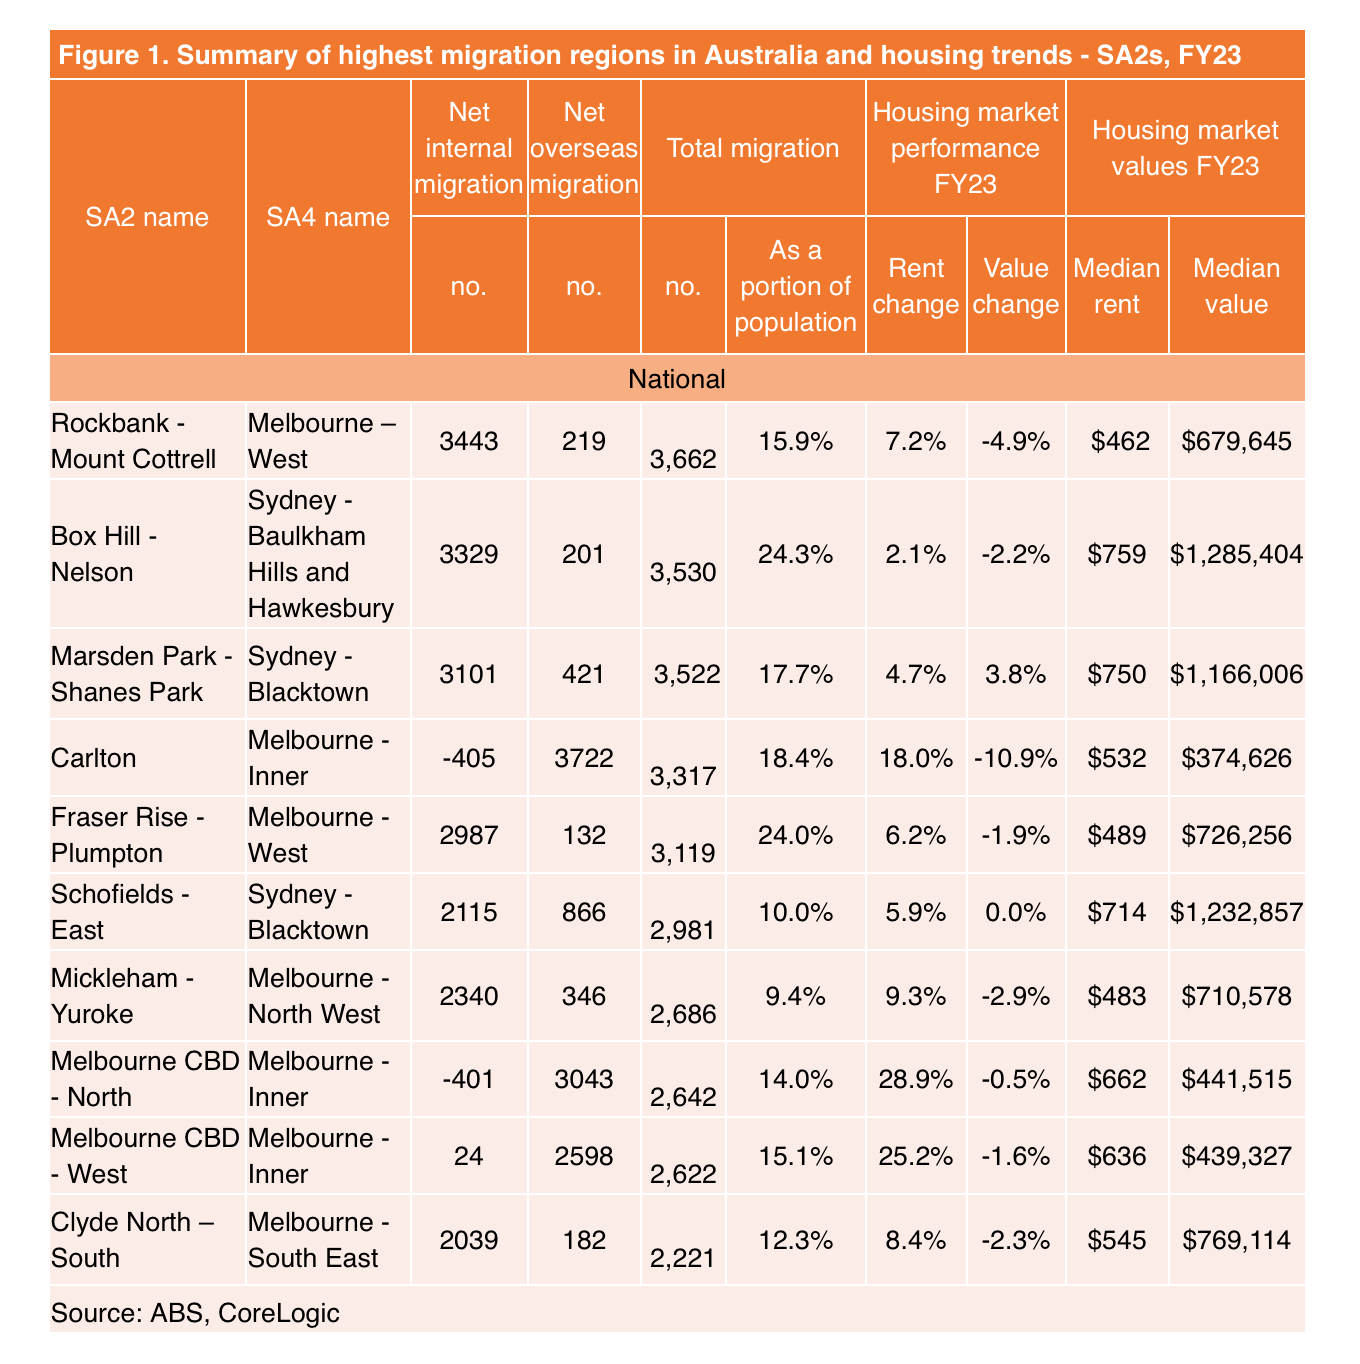
Figure 1 shows the top 10 SA2 regions¹ in net migration over FY23, as well as the change in rent and values in the same period. All are located in Sydney or Melbourne. Interestingly, most of the areas with the highest migration in Australia saw the majority of arrivals from internal migration. This accounted for around 90%+ of the migration to six of the top 10 regions.
The highest migration location in the country was the SA2 region of Rockbank – Mount Cottrell, which is on the western fringe of the Melbourne metropolitan region. In the year to June 2023, the area saw 3,662 people added to the population through net internal and overseas migration. Rockbank – Mount Cottrell was also the highest migration area in Australia in the previous year. The area has seen rapid development of new housing stock over the past few years, with CoreLogic estimating housing stock in the region more than doubled over the five years to June 2023.
Outside of Sydney and Melbourne, migration numbers were highest in the Chambers Flat – Logan Reserve region of Brisbane. This market did have a notable uplift in rents through the year of 9.6%, but this was only fractionally above the Greater Brisbane annual rent growth of 9.4%. Chambers Flat – Logan Reserve is another region with pockets of new housing development, and rose through the ranks when it came to the number of migrant arrivals, up to 17th highest nationally from 24th position in the year prior.
Alkimos – Eglinton in Perth’s North West had the highest total migration of any market in Perth. This was comprised mostly of internal migration (75%), but also a decent uplift in net overseas migration. This coastal region is towards the northern fringe of Greater Perth, offering an exceptional combination of lifestyle and affordability with a median dwelling value of $511,000 at June last year. The region also jumped the ranks of popular migration hot spots to 25th nationally, from 39th the year prior.
Munno Para West - Angle Vale had the highest volume of migrants in Adelaide over FY23, and ranked 30th nationally. The vast majority of migration to the region was from internal migration (93%), and both home values and rents rose over 10% in the year to June 2023. The capital growth trend in the area was substantially higher than the 1.3% rise in Greater Adelaide home values, and may reflect a spike in demand for relatively affordable housing in the context of rising rates.
What does it tell us about migration and the housing market?
ABS data indicates that most of the internal migration to Melbourne’s West comes from the Melbourne – Inner region, and the North West of Melbourne. This may represent people upsizing from smaller and/or rented property in more central locations, to detached houses that are relatively affordable. In the same period, rent values did rise 7.2% in Rockbank – Mount Cottrell, but this was well below the broader uplift in rents in the Greater Melbourne market, which was 11.3% in the same period.
Other top migration hot spots had similar characteristics where the change was largely explained by internal migration. Box Hill – Nelson, Marsden Park – Shanes Park and Fraser Rise – Plumpton are all examples of ‘urban sprawl’, set on the fringes of Sydney and Melbourne, and attracting a fresh wave of demand from upsizers and family home buyers.
None of these areas with high internal migration saw a particularly big pick up in rents or home values in the same period. That’s likely because the fresh housing supply of these areas is determining the population growth, and not the other way around. Off-the-plan house purchases likely mean that buyer demand in the suburb was spurred before people moved to these areas.
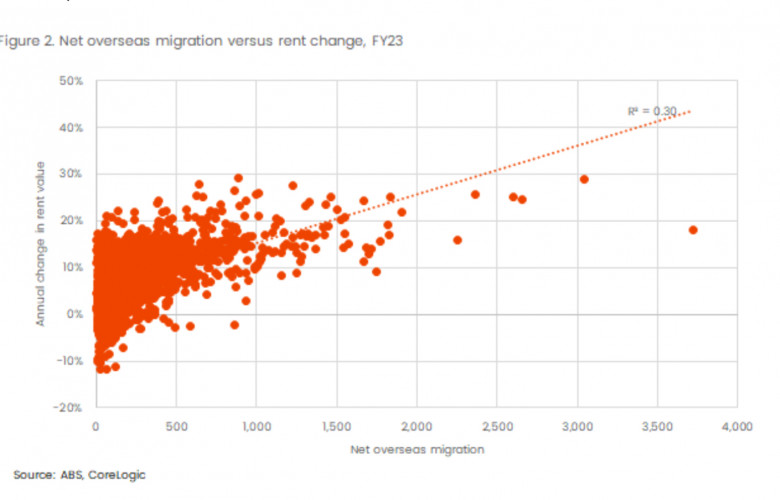
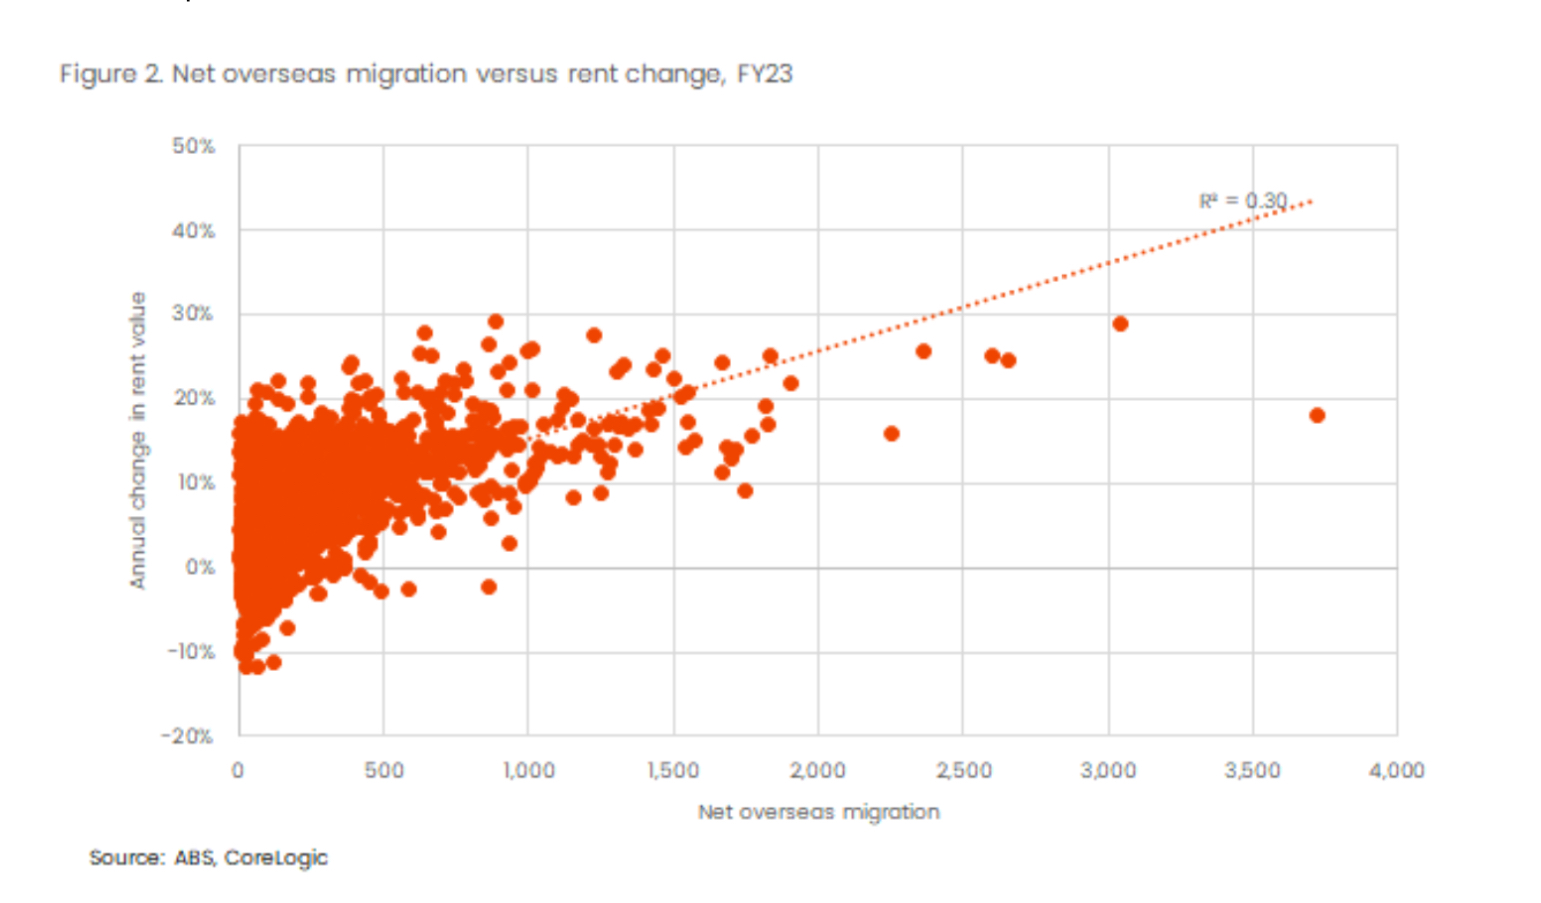
There’s a very different dynamic for regions in the top 10 that saw the biggest migration because of net overseas migration. These included Carlton, the Melbourne CBD - North and Melbourne CBD -South. As noted in previous research, the biggest short-term impact in areas that experience a rapid influx of overseas migration is in the rental market, with research from the ABS suggesting around 60% of recent permanent migrant arrivals rented in Australia in the five years to 2021, and census data in 2021 showed around 65% of temporary migrants were renters. Given over 90% of net overseas migration to Australia in the year to September 2023 were temporary migrants, there could be an even higher portion of recent migrant arrivals skewing to rentals than usual.
This is reflected in SA2 region rent performance over the 12 months to June 2023 (figure 2), which shows a weakly positive correlation between net overseas migration by region in the period, and 12-month change in the hedonic rent value index. Net overseas migration volumes were also compared with value change, but there was no discernible relationship.
Similar to overseas migration and home value change, there was no relationship evident between internal migration and rents, and internal migration numbers and home value. The ‘R2’ value for these relationships (which represents out of 1 how powerfully changes one variable explains changes in another) was less than
The takeaway is that high migration levels can have a multitude of impacts on housing markets, which may depend on other factors like supply and affordability. In the context of limited borrowing capacity, affordable markets on the fringes of Perth, Adelaide and Brisbane have attracted an increasing share of internal migration, rising through the ranks of migration hot spots, and attracting value growth. However, in some areas associated with urban sprawl, home values have not risen strongly at the same time migration volumes have been high, and may have to do with more balanced levels of supply, or the timing of off-the-plan purchases. The only migration-housing performance relationship demonstrated in the data over the short term, and weakly at that, continues to be between overseas migration and rents.
By Eliza Owen, Head of Research Corelogic Australia.