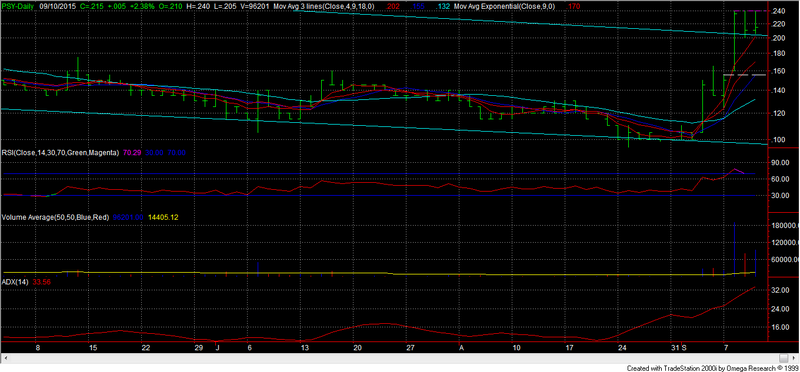
Observing today’s chart.
It appears to be a triple top at 24.
Or is a pennant on the form? Depends if the sp consolidates above 20.0/20.5. (the new support area after the recent breakout)
A few overbought indicators atm [rsi, stochastics, rate of change], but the others are ok.
There’s also support around the general vicinity of 17.5 (& 15.5 gap level) IMO.
But a break of 24 would be fine to end the week tomorrow.
Perhaps even if it holds up, so that any retracement is kept to a minimum before the possibility of a new weekly high next week.
All just opinion anyway.
Best regards for tomorrow punters!
P$Y Chart, page-159


Add HYD (ASX) to my watchlist
 (20min delay) (20min delay)
|
|||||
|
Last
1.4¢ |
Change
0.000(0.00%) |
Mkt cap ! $3.559M | |||
| Open | High | Low | Value | Volume |
| 0.0¢ | 0.0¢ | 0.0¢ | $0 | 0 |
Buyers (Bids)
| No. | Vol. | Price($) |
|---|---|---|
| 2 | 740000 | 1.3¢ |
Sellers (Offers)
| Price($) | Vol. | No. |
|---|---|---|
| 1.5¢ | 11654 | 1 |
View Market Depth
| Last trade - 19.00pm 10/06/2024 (20 minute delay) ? |
| HYD (ASX) Chart |
Day chart unavailable