why the discrepancies. In march 2012 the Hadcrut3 dataset was superseded by the Hadcrut4.
When will the adjustments stops. Every week i hear of updates to data.
Just curious has anyone ever seen of revised downward temp adjustments.
Yes it is old news. ButI have only just noticed this.
How can anyone say with 97% certainty that science is settled.
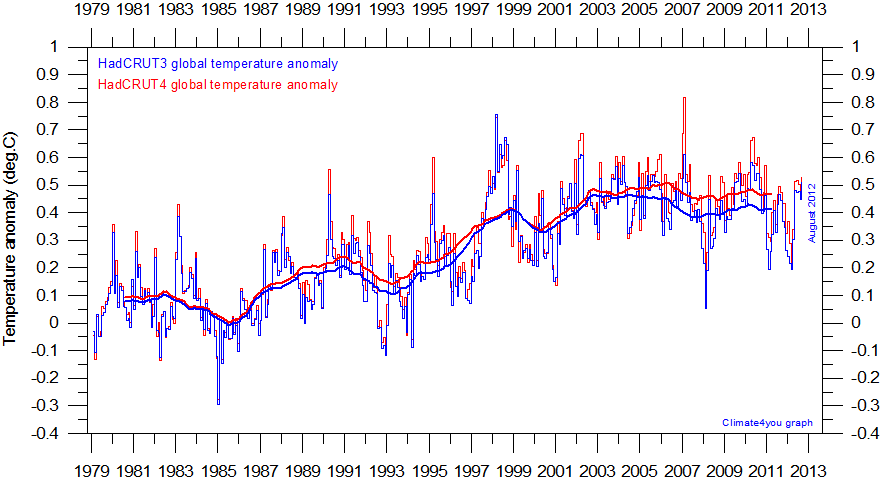
Look at the 2 graph's below. How much knowledge does has one acquired since 2012. Are they able to justify some pretty big adjustments (in excess of 200%) to modelled data previous to 2012.

This next one clearly shows the 98 peak on the pre 2012 data set.
I am also just stunned at how the 2007 data anomaly was increased by over 230% (approx.)