The media continues to report that the world is greatly oversupplied with oil and this continues to have a negative effect on oil prices.
The EIA and IEA both appear to be underestimating worldwide demand for oil by nearly 2 million barrels per day.
The EIA lacks reliable production figures for any state except for Alaska.
The figure that the EIA adds to actual crude oil stocks before reporting has increased greatly in recent weeks.
The oil price decline has led to cutbacks in capital spending, which is likely to exacerbate an oil supply shortage going forward.
For quite some time now, the media has been discussing the oil supply glut that has been blamed for pushing down the price of oil from its previous peak in the middle of last year. However, there is now an increasing amount of evidence that the extent of the supply glut has been overstated or may not even exist at all. If this is correct, then it will almost certainly prove bullish for oil prices going forward.
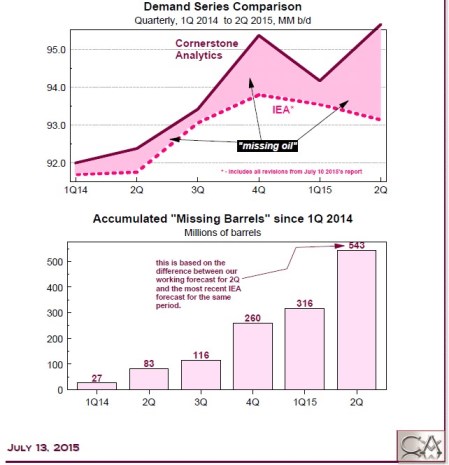
The numbers that support the presence of an oil supply glut in the United States and internationally largely come from two agencies – the Energy Information Administration and the International Energy Agency. However, there are other independent institutions that also track supply, demand, and production trends in the energy markets. One of these is Cornerstone Analytics, founded by Michael Rothman, former head of ISI’s integrated oil research division and International Investor’s top-rated Independent Energy Researcher since 2006. Over the past few years, this firm has published supply and demand figures for oil that directly contradict the official figures from the government agencies. According to Leonard Brecken of OilPrice.com, the current production of oil worldwide is approximately 95 million barrels per day. There is little dispute about this figure as the IEA Oil Market Report stated that January 2015 worldwide production was approximately 94 million barrels per day. However, according to Cornerstone Research, worldwide demand for oil was in excess of 94 million barrels per day in the first quarter of 2015 and is more than 95.5 million barrels per day today. Furthermore, the firm also states that worldwide oil demand was in excess of 95 million barrels per day in the fourth quarter of 2014. These figures are consistently higher than IEA estimates.
Source: Cornerstone Analytics, OilPrice.com
In other words, if Cornerstone Analytics’ figures are correct, and there is reason to believe that they may be, then not only is there no global oil glut but in fact there appears to be a worldwide oil shortage.
One thing that is important to keep in mind to understand the rest of this article is that the production numbers provided by the Energy Information Administration are only estimates. The only numbers that are not estimates are the real-time production figures for Alaska. As such, there is no guarantee that these numbers are accurate. The Energy Information Administration provides information about the methodology that it uses to derive its production figures. In short, the agency relies on various reports that are provided by the states, which are oftentimes inaccurate, incomplete, and can take years to reconcile. Estimating oil demand is even more difficult as it requires analyzing consumer habits, the weather, and global GDP growth, among many other factors. As can be expected, these factors can be expected to result in numerous reporting errors.
On Tuesday, April 7, 2015, OilPrice.com reported that the Energy Information Administration revised downward its prediction for 2015 crude oil production growth to 550 thousand barrels per day from 700 thousand barrels per day. That is a decline of 21% from the previous estimate. It also revised downward its prediction for 2016 crude oil production growth to 80,000 barrels of oil per day from its previous level of 140,000 barrels per day. That is a 42% reduction compared to the previous estimate. This provides evidence that U.S. oil production will not be growing as quickly as many believed thus casting doubt upon the length of and extent of the oil supply glut.
Another very interesting event occurred at the end of May that highlights the problems with the official numbers by the Energy Information Administration. As OilPrice.com reports, for the week ended May 22, 2015, the EIA reported that oil production in the United States increased by approximately 3% compared to the previous week. This follows a nearly three-month period in which oil production remained relatively flat. Furthermore, at the time, rig counts had been declining since October. This makes such an increase in production rather unlikely as oil production typically cannot be increased that quickly and it most certainly cannot without the use of more rigs. Of this production increase, much of it was in the lower 48 states. During that week, Alaskan production increased by approximately 95,000 barrels per day. As already mentioned, Alaskan production numbers are reported in real-time are so are likely to be accurate. However, the remaining 205,000 barrels per day increase took place in the lower 48 states, where production figures are often based on inaccurate numbers, as already discussed. The way that the EIA accounted for this increased production is to increase the March baseline production number by 130,000 barrels per day and then state that production increased again by 75,000 barrels per day during the week of May 22. The agency provided no rationale for either of these numbers and, once again, rig counts were declining over the period. Some on this site and in the media have attributed the production increases in spite of rig count declines to the movement of drilling rigs from marginal production areas to “sweet spots,” where oil production is highest. While it is true that moving rigs to the areas of highest production could offset the production declines that would normally be expected with a declining rig count, it cannot account for all of the discrepancy. Furthermore, there is evidence that per well production in the “sweet spots” of the Bakken shale formation has been declining for quite some time. “Sweet Spot” Bakken Shale Well Production in First 24 Hours – November 2013 to Today
Source: NDIC Daily Activity Report, OilPrice.com
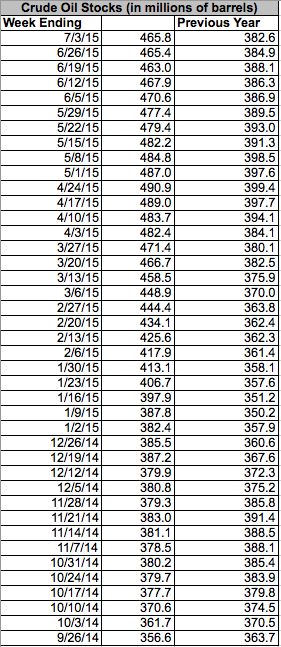
Even if we accept that the EIA’s figures showing growing oil production are accurate, it has not been sufficient to meet the increased demand caused by the summer driving season. This is evident by the fact that despite the reported production increase, the nation’s commercial crude inventories declined by 2.8 million barrels during the week of May 22. In fact, the nation’s inventories of commercial crude oil began to decline during the week ended May 1, 2015, a trend which has continued through to today. Although the last two oil inventory reports do indeed show rising levels of crude oil in inventories, these inventories have not yet regained their previous levels. This also casts doubt on the various reports that state that the world has a two million barrel oversupply of oil.
Interestingly, one of the things that caused oil inventories to begin to climb again is that during the week of June 12, 2015, the lower 48 states managed to increase production by a remarkable 76,000 barrels per day. As already mentioned, the production figures for Alaska are likely reliable and that state saw its production decline by 61,000 barrels per day. These two figures combined result in an increase of 15,000 barrels per day or approximately 105,000 barrels per week. However, over the course of the next week, inventories declined by 4.9 million barrels of oil and then increased by 2.4 million barrels the following week.
The timing of these production increases has made Leonard Brecken very suspicious as they came at around the same time that inventory draws began. However, even more suspicious is that the “Miscellaneous to Balance” figure used in calculating inventory also increased sharply at around the same time. The Miscellaneous to Balance figure is simply an adjustment used by the EIA when calculating inventory, theoretically used to make crude oil inventories match with production, imports, crude runs, and crude oil demand. Essentially, this is a figure that is added to or subtracted from the actual amount of crude oil in the nation’s commercial inventories before the figures are reported. This chart, courtesy of Cornerstone Analytics, shows how this figure has varied over the past several months with positive numbers indicating that the EIA added barrels to the amount of crude oil actually contained in the inventories and negative numbers indicating the opposite.
Source: Cornerstone Analytics, OilPrice.com
According to Cornerstone Analytics, if the reported numbers were correct, then crude oil stocks should be thirty million barrels higher than they are just since April. As Leonard Brecken points out, this is roughly the entire amount of oversupply in the United States compared to the mean. In other words, this indicates that there is in fact no oil supply glut in the United States and if the earlier oil demand chart was accurate then there may in fact be an oil shortage worldwide.
Unfortunately for both oil companies and investors in the sector, the decline in oil prices caused by the reported glut has had very real consequences. Aside from the obvious declines in revenues, cash flows, and net income incurred by oil companies, the decline in oil prices has also caused major exploration and production companies to scale back on both exploration and capital spending programs. This will ultimately result in fewer oil fields being developed going forward along with the likelihood of eventual production declines as currently producing fields begin to produce lower quantities of oil. Ultimately, this could exacerbate the supply shortage that may already exist worldwide. seeking alpha
STO Price at posting:
$5.82 Sentiment: None Disclosure: Held


 (20min delay)
