Disclaimer: first time posting charts on HC so please bear with mehappy to welcome all your expert feedback and criticism. Thanks to V* and others for some basic advice on where to start.
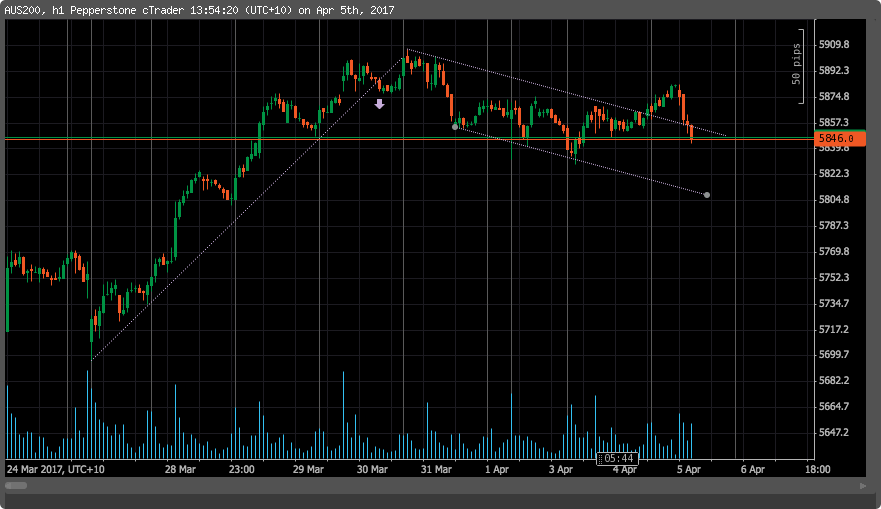
Here's my take on a few short-term charts. XJO had a small fakeout of the downtrend channel overnight but is back in place (after hitting a stop loss of a short of mine
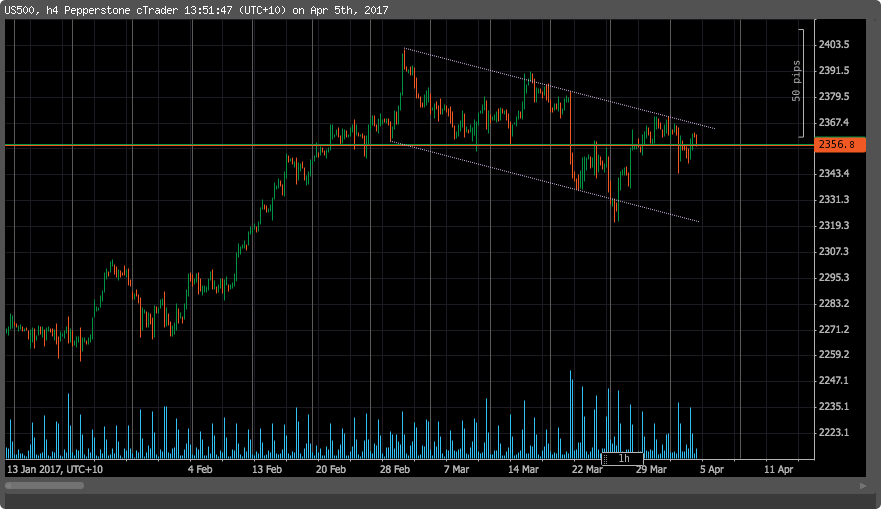
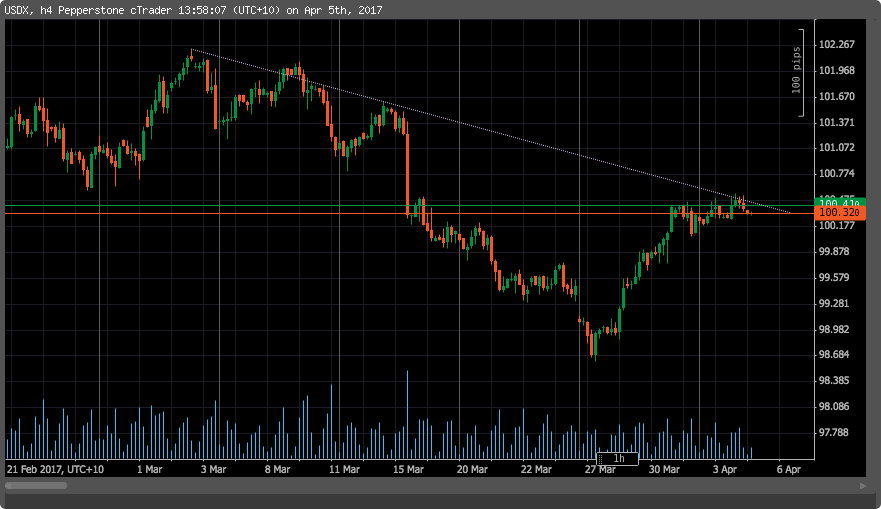
Similar uncertainty for the S&P500 futures and USD index. Clearly trending downwards for the last month or so and behaving roughly as expected underneath/within their respective trendlines. How much longer can the yanks milk these puppies for? My personal opinion is, I have no f&^%ing idea. Meanwhile, I'm content in trading the swings with tight stop losses. Charts below:
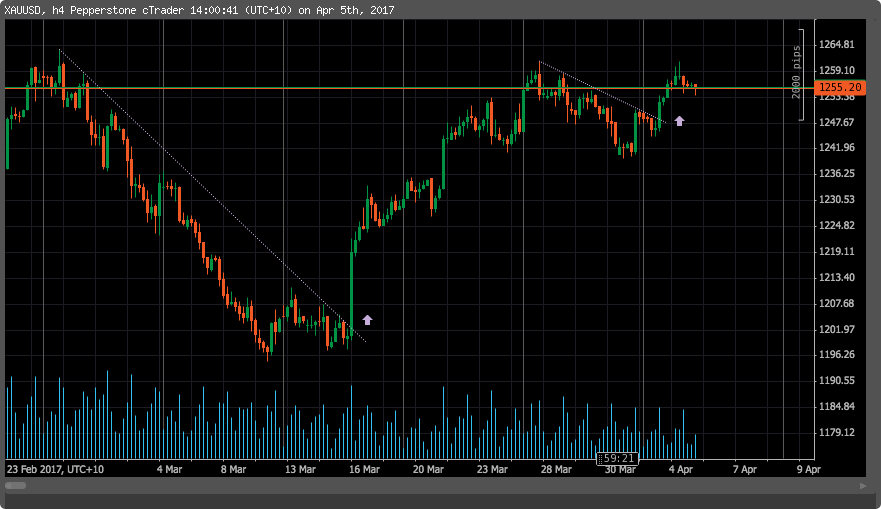
Lastly, the hotly debated gold chart. Again I'm only looking at the relatively short-term, but after a mini-breakout this week, we were met with serious resistance around 1260-65 as predicted. A look at the long-term chart with the 2011 downtrend in place indicates there may be some serious work to do before busting out and heading towards $1300+. Maybe the French election could be some sort of a catalyst if Le Pen surprises us? Again, I have no idea
Looking forward to all feedback and commentary from the more refined chartists
Disclaimer: first time posting charts on HC so please bear with...


Add XSO (ASX) to my watchlist
 (20min delay) (20min delay)
|
|||||
|
Last
2,976.3 |
Change
3.700(0.12%) |
Mkt cap ! n/a | |||
| Open | High | Low |
| 2,972.6 | 2,984.5 | 2,964.8 |
| XSO (ASX) Chart |