Greenland and Antarctica's accelerating ice loss
Carbon Brief
A series of maps published this week show Greenland and Antarctica are losing more ice than at any time since satellite records began.
Scientists found the two vast ice sheets are losing a total of 500 cubic kilometers of ice per year, contributing to rising global sea levels.
Ice loss
The researchers used data from the European Space Agency's
CryoSat -- a satellite that passes over the earth at 700km above the surface and measures the thickness of polar ice.
The satellite was launched in 2010 and has been collecting data on sea ice and ice sheets ever since. By comparing data with other satellite missions, scientists can see how quickly the ice sheets are changing.
The study, just published in the journal
The Cryosphere, reveals that since 2009, the volume of ice loss has tripled in West Antarctica and more than doubled in Greenland. This is the highest rate of ice loss since satellite records began 20 years ago.
Regional differences
The maps show that Greenland is losing around three times more ice than Antarctica, including thinning of the entire western ice sheet and further losses in the southeast and northwest ice sheets. You can see where the greatest losses of ice are occurring in the red areas in the maps below.
In Antarctica, the maps show thinning of the West Antarctic Ice Sheet and the Peninsula. East Antarctica shows some increases in thickness (shown in blue in the maps), though this doesn't outweigh the losses elsewhere. Overall, more ice is being lost than gained.
Figures 1 and 2: Elevation changes in Greenland (top) and Antarctica (bottom) between January 2011 to January 2014. Areas in red show loss of ice; blue shows gains.
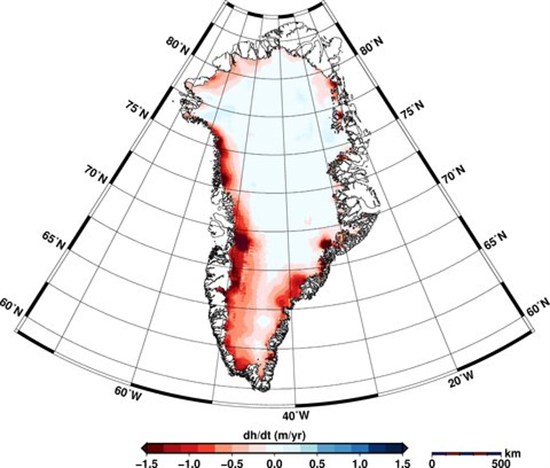
 Source: V. Helm et al. (2014)
Satellite measurements
Source: V. Helm et al. (2014)
Satellite measurements
CryoSat collects data at 200 million points in Antarctica and 14.3 million in Greenland, as a
BBC article last week notes. Satellites can measure ice sheet heights by firing a radar pulse at each point and recording the time it takes for the signal to bounce back.
The data is used to create digital elevation models that provide a 'snapshot' of the state of the ice sheets covering the two land masses. You can see how the ice thickness varies over the surface of the earth in the figures below. The areas in red show thicker ice towards the middle of the land mass and the blue areas show the thinner ice around the edges.
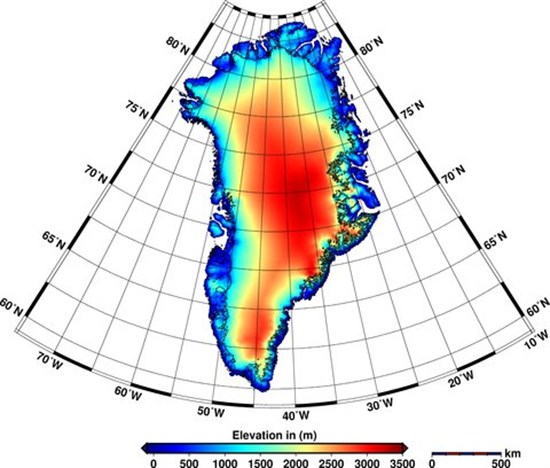
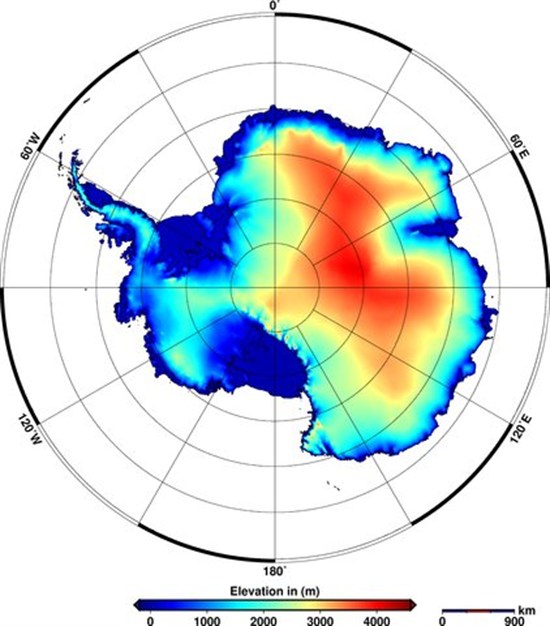 Elevations of ice in Greenland (top) and Antarctica (bottom) in 2012. Red shows areas of thicker ice; blue shows thinner ice. Source: V. Helm et al. (2014)
New imagery
Elevations of ice in Greenland (top) and Antarctica (bottom) in 2012. Red shows areas of thicker ice; blue shows thinner ice. Source: V. Helm et al. (2014)
New imagery
These aren't the only new satellite images to be released this week. A Canadian collaboration, including the University of Waterloo and the Canadian Space Agency,
released a satellite 'mosaic' image of the whole of Antarctica.
The image, shown below, is made up from over 3000 satellite images taken in 2008.
 Mosaic satellite image of Antarctica. Source: University of Waterloo
Last week's
Mail Online covered the new research, featuring some of the satellite's images -- such as the one above -- including a close-up of an individual ice shelf.
The team behind the image also produced an equivalent version from images taken in 1997 and hope that being able to compare the two could help scientists identify changes in the ice sheets over Antarctica.
The next steps for the team include providing more regular updates to the Antarctic image, and creating a similar mosaic image for Greenland.
Originally published by Carbon Brief. Reproduced with permission.
http://www.businessspectator.com.au...eenland-and-antarcticas-accelerating-ice-loss


