CONTENTS
1.Australian Market: Sector Performances - January
2.Australian Market: Sector Performances – Past Six Months
3.Alternatives to Oz Shares: ETF Performance– Past Six Months
4.Australian Market: Monthly Chart - XJO
5.Australian Market. XJO - Weekly Chart
6.Australian Market. XJO - Daily Chart
7.Australian Market: XHJ
8.Australian Market: XTJ
9.Copper Futures - Daily
10.Summary and Conclusion
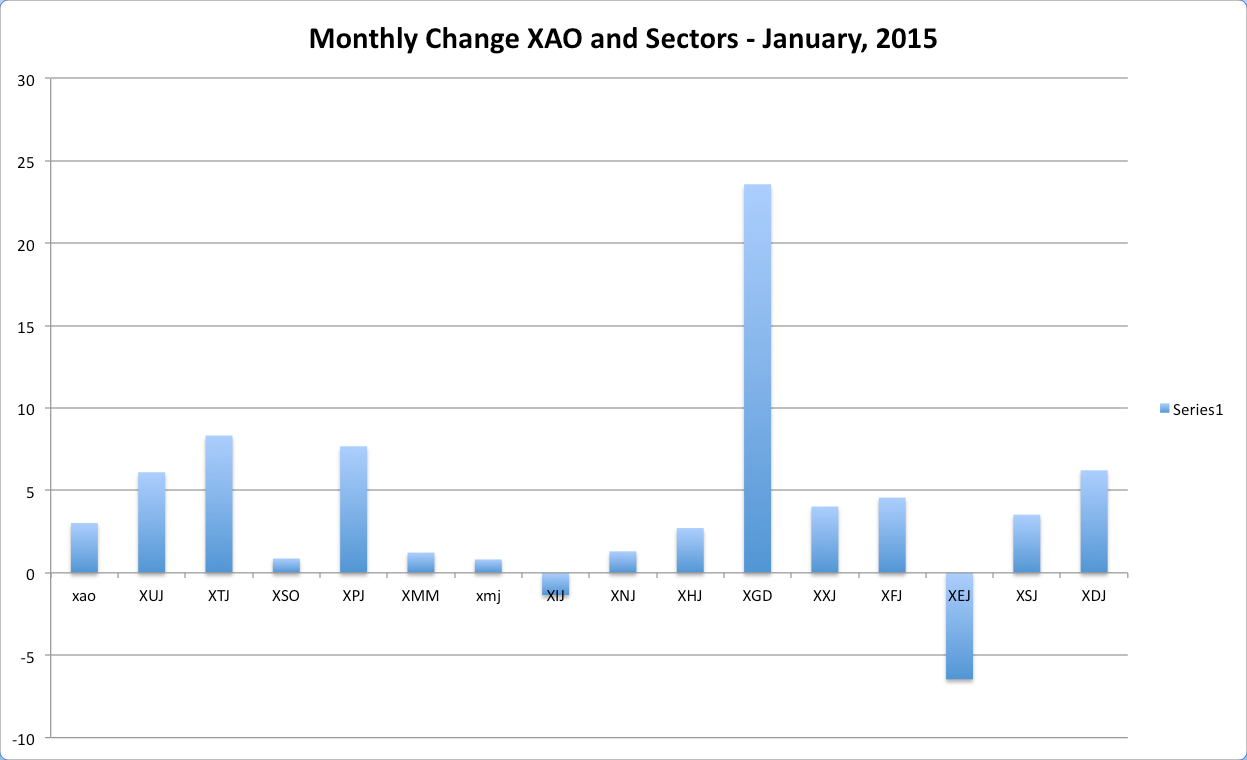
Australian Market: Sector Performances - January
XAO up strongly +3.02% in January. The Australian market was open for 19 trading days during the month and went up on 13 of those days, that’s almost 70% positive. The market was up the past seven days in a row. That’s rare. So some sort of a set-back can be expected in the near future.
Eight out of ten S&P Sectors were up. The two Sectors down were the inconsequential Info. Tech (-1.34%) and Energy (-6.46%). The two best sectors were Telecoms (+8.33%) and Consumer Discretionary (+6.22%).
That’s a good start to the first month of the year and is in sharp contrast to America (SP500 -3.1%) and China (China88 -5.55%; but pales when compared with Germany (DAX +8.78%).
In the other sectors, Gold Mining was the stand-out (XGD +23.58%) with Property performing strongly XPJ (+7.7%)
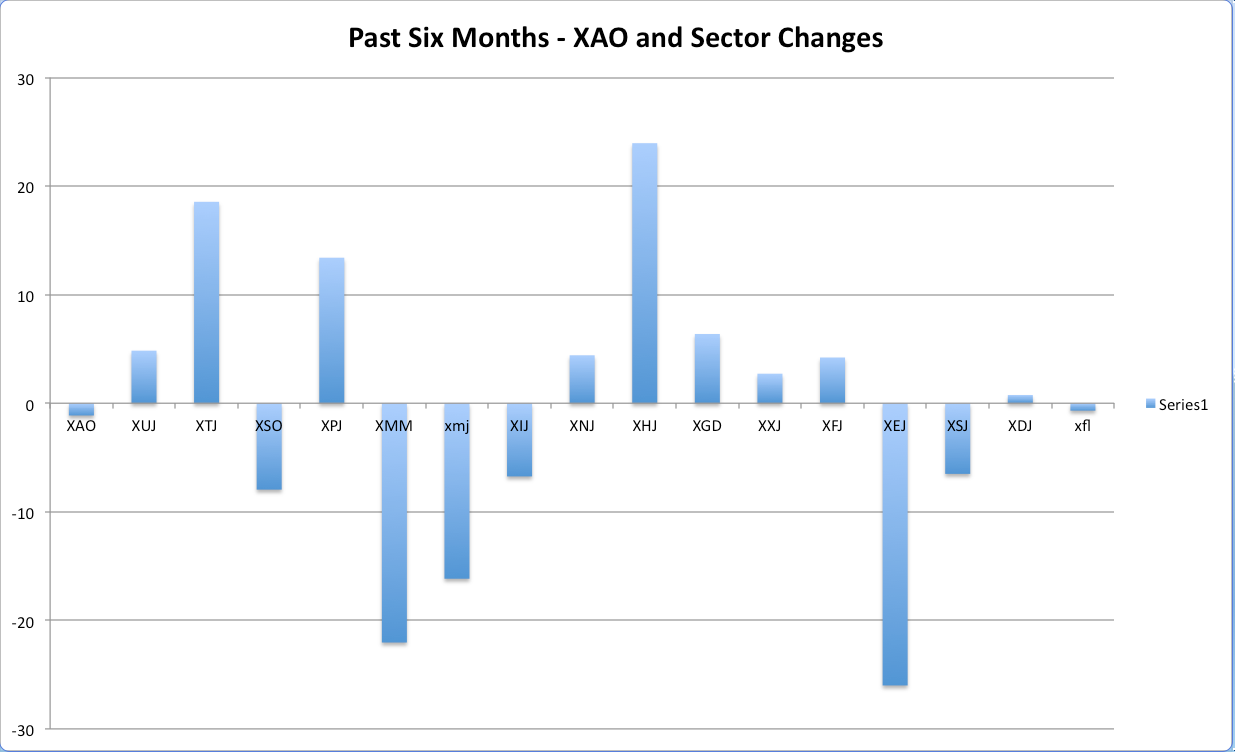
Australian Market: Sector Performances – Past Six Months
XAO has been relatively flat over the past six months, down -1.13%. Six out of ten S&P Sectors were up. The worst two performing Sectors were Energy (XEJ -26%) and Materials (XMJ -16.17%).
The two best sectors were Health (XHJ +23.95%) and Telecoms (XTJ +18.55%).
The two best performing sectors are both defensives. They usually perform better in flat or falling markets.
Given their out-performance over the past six months, they continue to be the sectors of choice.
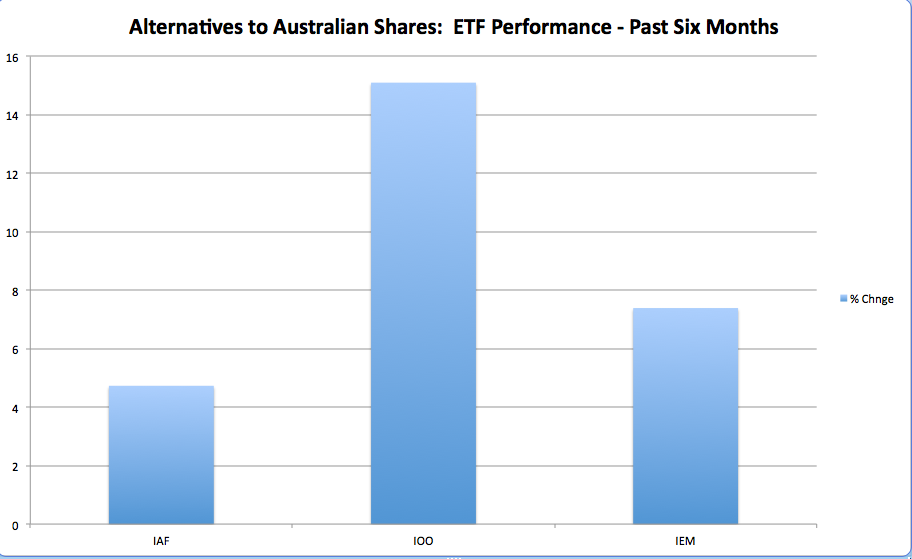
ALTERNATIVES TO OZ SHARES: ETF PERFORMANCE – PAST SIX MONTHS
Many alternatives to Australian shares exist for investors. Direct investment in overseas shares is difficult because of costs.
But a large number of ETFs traded on the Australian Stock Exchange now exist which enable Australian investors to invest quickly and efficiently in diversified portfolios of overseas shares.
I’ve chosen two of the best known from Black Rocks iShares as examples of ETFs for international shares, IOO (iShares Global 100 ETF) and IEM (iShares MSCI Emerging Markets ETF). Virtually no overlap exists between these two ETFs.
In the past six months, IOO (Global 100) is up +15.1% and IEM (Emerging Markets) is up 7.39%. Both easily outperforming the Australian All Ordinaries (-1.13%) and did better than eight out of 10 of the S&P Sectors on the Australian markets.
The third alternative in the graph is a fixed income ETF, IAF (iShares Composite Bond ETF) which is invested mostly in Australian Government Bonds. It is up +4.73% which also beats eight out of ten S&P Sectors on the Australian Stock Exchange.
Bonds are often used in a diversified portfolio to reduce risk and maintain a steady income flow. (What actions a particular investor might take depends on many personal factors – beyond the scope of this report to discuss.)
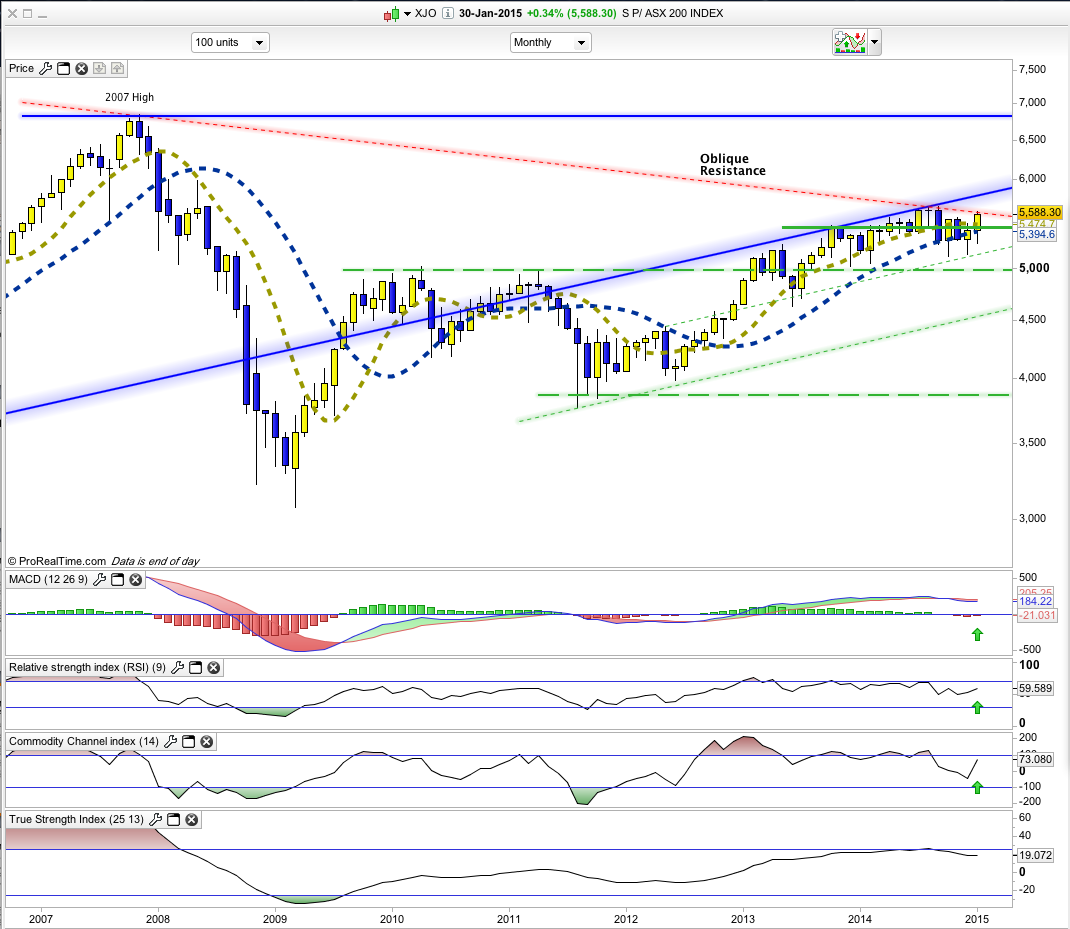
Australian Market: Monthly Chart - XJO
XJO up this month, +3.28%. Three out of the past four months have been positive and long lower tails suggest solid buying pressure.
For some months I’ve been saying that caution is needed with the Australian stock market. Matters improved this month with indicators turning up. The chart is back above the 10-Month Moving Average. That’s a positive. Also, the 10MMA remains above the 20-MMA. If a negative x-over occurs – we may be in for a 2008 style decline.
The chart needs to get above the oblique downtrend resistance line marked on the chart to suggest the worst is over. February appears to be crucial.
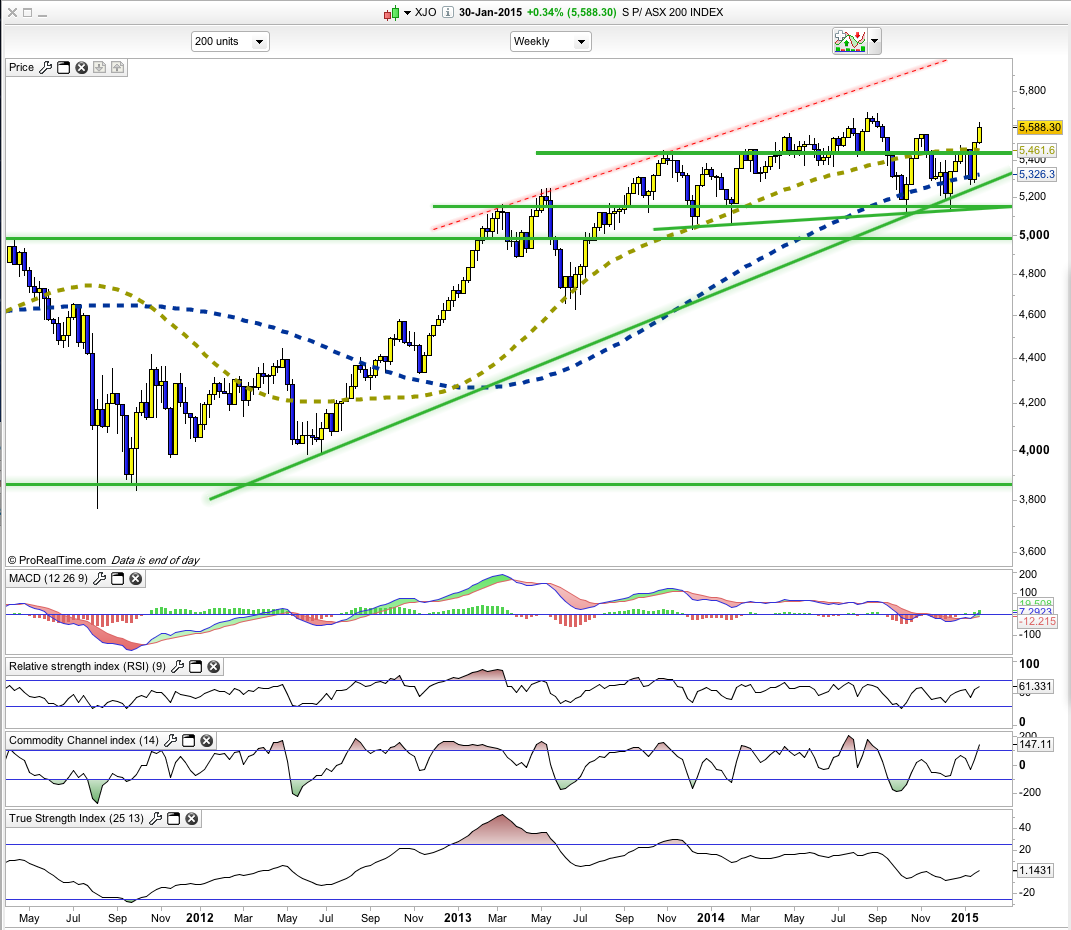
Australian Market. XJO - Weekly Chart
XJO up this week +1.57%. The previous week it was up +3.82%. The past two weeks has seen a strong bounce off the 100-Week Moving Average which took the Index back above the 50-Week Moving Average. The highs of August, 2014 seem to be within reach.
The technical indicators have improved and are generally positive without reaching into overbought territory.
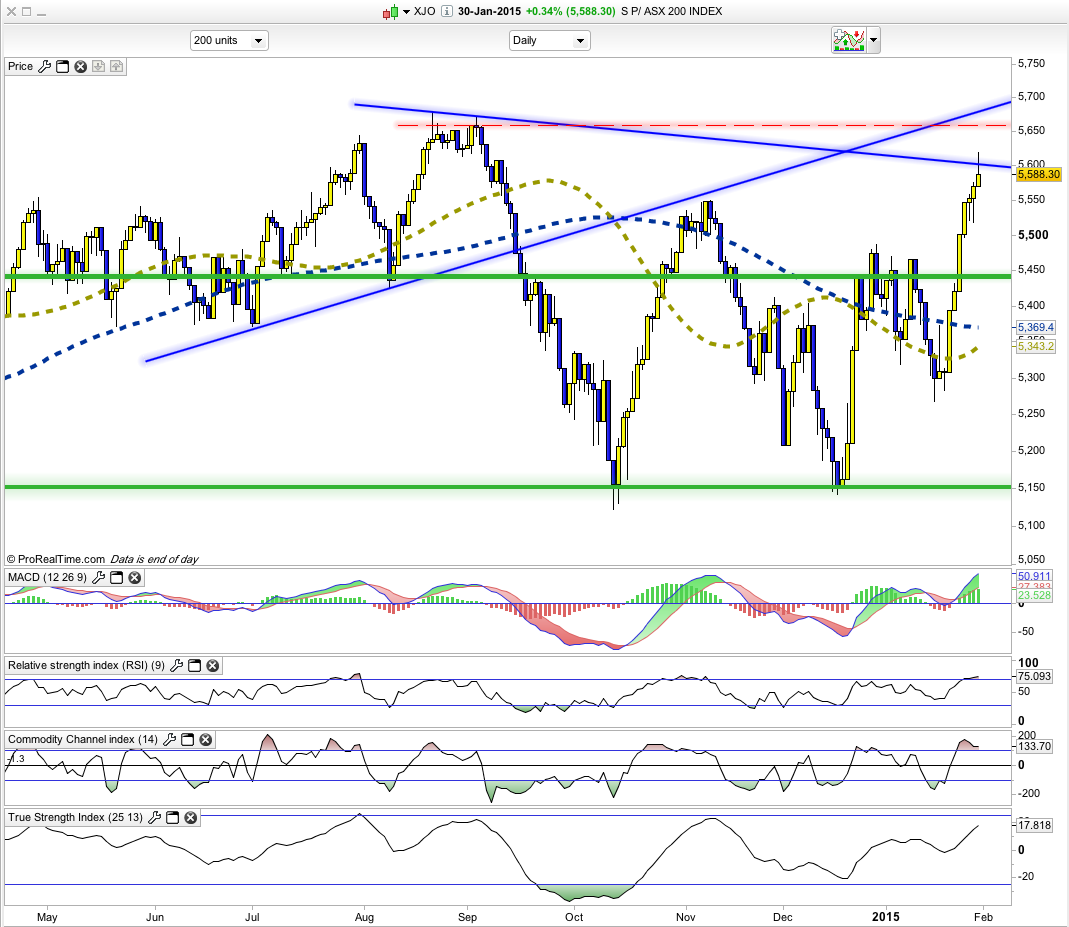
Australian Market. XJO - Daily Chart
The XJO has been up seven days in a row. Seven days in a row is rare. It’s been up eight out of the past nine days, with the only down day going negative by a smidgin -0.03%. That’s been a very strong performance, and likely in need of a rest.
Friday’s action supports that view. The chart poked above the restraining oblique down trend line then sold off with the daily candle forming a “shooting star” which is often bearish. A down day on Monday is needed to confirm.
Indicators:
1.MACD Histogram. Above zero. Positive but may be forming a negative divergence.
2.MACD. Above zero. Positive.
3.RSI.9 is at 75.1. Overbought.
4.CCI.14: +133.7. Turning down - negative.
5.TSI: +17.82. Positve.
Indicators are mixed. After seven up days, a short term breather seems the likely outcome.
The Weekly RSI (previous chart) is still well below the overbought level. We usually need to see strong overbought readings on both the Daily and Weekly Charts to suggest the possibility of a strong reversal. So we may get some pull-back and then further upside to challenge the August, 2014 highs.
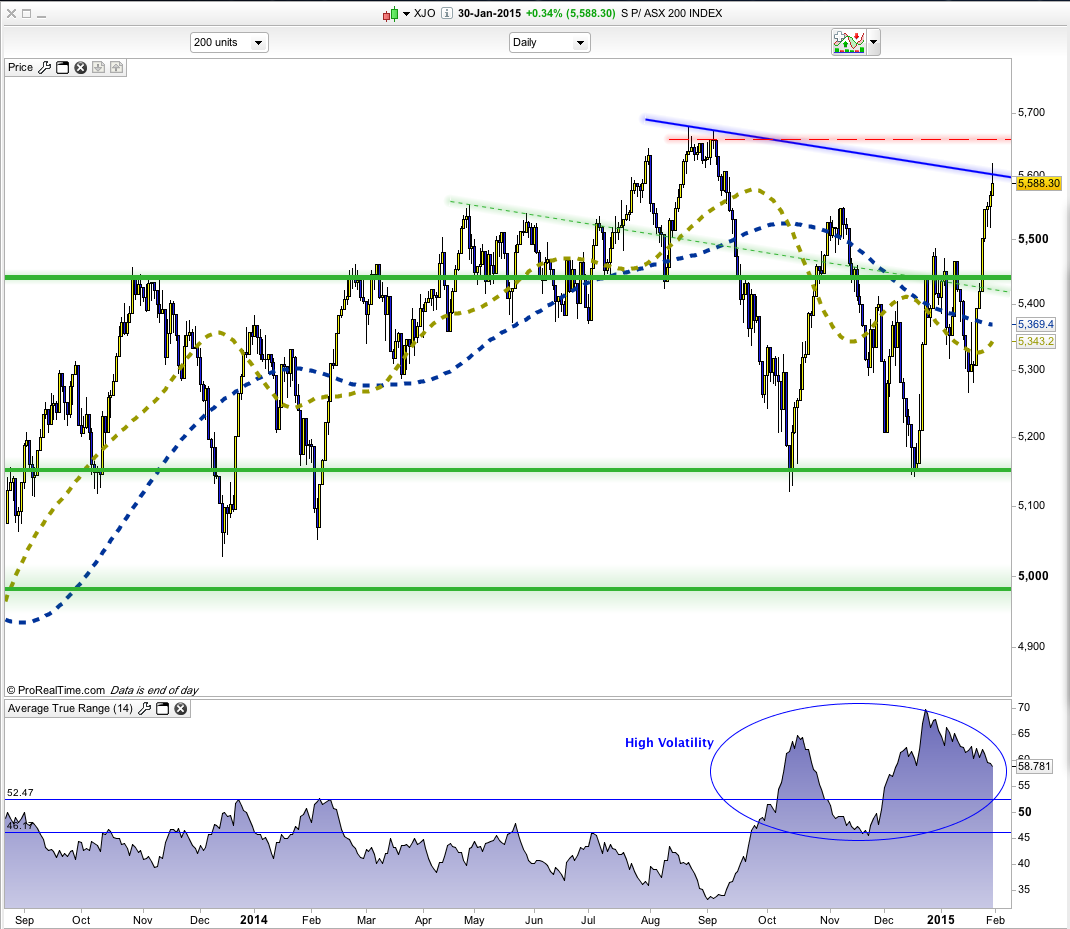
(Note: Volatility has increased sharply since September, 2014. (See lower chart.) This makes for heart-stopping reversals both up and down. Until the volatility settles down, this market might best be left to short-term, experienced traders who revel in such conditions.)
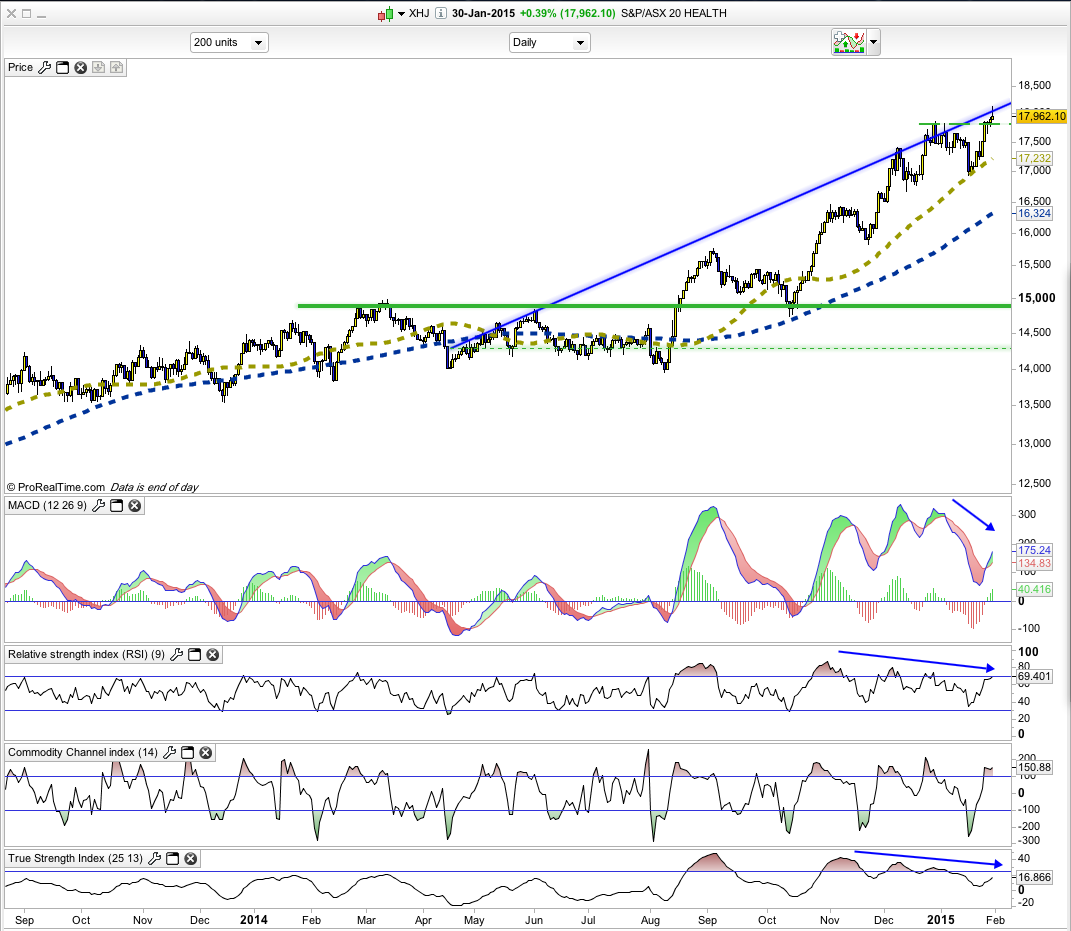
Australian Market: XHJ
XHJ (Health Sector) popped up as the best performing sector over the past six months. It’s often best to stay with strength.
But … does that mean it is time to buy right now?
Maybe not. The attached chart suggests it might be best to wait for a pull-back before entering. Most indicators are showing negative divergences. This can happen and the stock can continue to make new highs – if the up trend is slow and steady.
That seems to be the case with XHJ. But a pull-back to the 50-Day MA might provide a good buying opportunity. If the 50-Day MA fails, then we’d look to buy at the 100-Day MA.
If the stock falls through the 100-Day MA, then we’d look to buy at the next major horizontal support level – about 14,900.
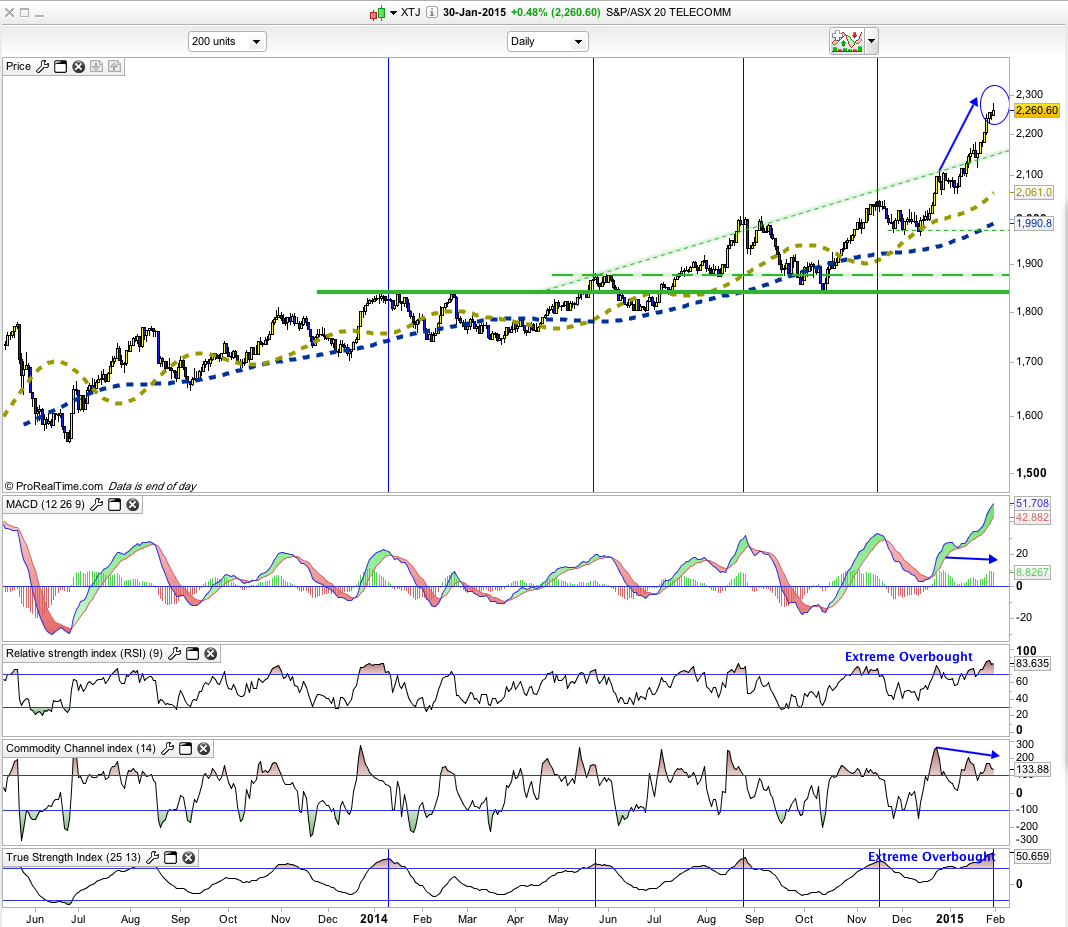
Australian Market: XTJ
Telecom Sector (XTJ) is the second best performing sector in the Australian market during the past six months and is dominated by Telstra.
Indicators:
1.MACD Histogram. Positive – but possible negative divergence setting up.
2.MACD. Above zero. Positive. But at the highest level in the past 18 months.
3.RSI.9 is at 83.6. Extremely overbought.
4.CCI.14: +133.9. Negative divergence setting up.
5.STI: 50.7. Extremely overbought. Over 20 is overbought.
XTJ is at such extremely high overbought levels, it would seem wise to wait for a pull-back before making a decision to buy. I've marked previous extreme overbought conditions with vertical lines on the TSI. Once the TSI turns down, look for the Index to pull-back to provide a buying opportunity.
The Index is now in an exponential rise – there is no knowing where such rises will finish – but they usually end with sudden falls. Buying at such levels could be dangerous.
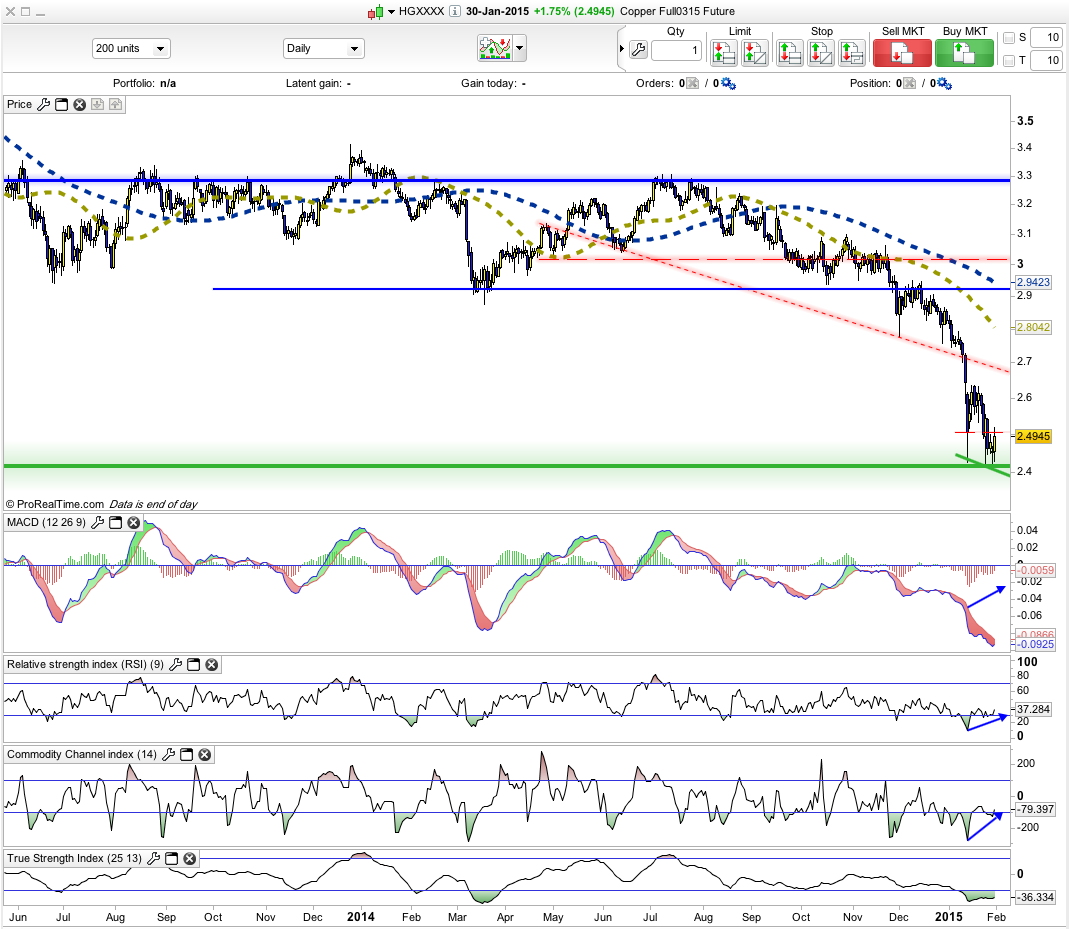
Copper Futures - Daily
Copper has been in a long-term down trend since early 2011. That has recently extended into a water-fall down. Like exponential rises, there’s no knowing where these may end. But, at this stage some sort of counter-trend rally looks likely. That should be of short term benefit to our miners.
Until, we see convincing evidence that Copper has reversed its down trend, it is probably best to leave the Australian Mining Sector alone – unless you’re an experienced short-term trader.
Summary and Conclusion
I’ve changed the format of this report from the one used for a very long time. I’ve now concentrated more on the Australian market and possibilities available there – after all that’s we’re we live, and, for most of us, only trade on the ASX. Another reason, however, is that the Australian market seems to have dislocated from the American market. We often look to the American market (and others) for a "lead" as to what will happen in our market. Currently, on a 30-Day basis, the correlation between Australia (XJO) and America (SP500) is positive but weak at 0.49. So I can’t see a lot of sense in looking at America (or other foreign markets) for clues as to what might happen in Australia.
For those who are interested, is a weekly summary of major world markets: Australia up +1.57%. German DAX up +0.42%. London down -1.22% SP500 down -2.77%, Japan up +0.93%. China88 down -5.35%. Global Dow (US$) down -2.4%. Emerging Markets (US$) -4.27% Copper Futures down-0.28% GLD (ETF for US$ Gold) down -0.63%. Crude Oil +5.81.
The Australian market is modestly overbought, with Friday’s candle a “shooting” star – so pull-back is likely. A down day on Monday would confirm.
The best two sectors in the Australian market over the past six months have been Health (XHJ) and Telecoms (XTJ). Both look likely to fall in the near term. And that should provide a buying opportunity some time in the near future.
I've also provided some alternatives to Australian stocks (Bonds, International Shares, Emerging Markets) which are easily available to traders/investors on the ASX via ETFs. IAF, IOO and IEF are currently (on a six month basis) outperforming eight out of ten sectors on the ASX. These provide opportunities for diversification and possible growth while the overall Australian market (XJO) is stagnant. IOO and IEF should be watched carefully as they are subject to currency risks.
Copper remains in a very long term down trend and shows no signs at this stage of reversing that situation. Short term it might be ready for a counter-trend rally which should benefit our miners. However, that is likely to be a short term phenomenon which should provide a selling opportunity for those still holding mining stocks.
Those are my thoughts. You might have different ones. That’s what makes a market.


 (20min delay)