Gotta love google -
These chart patterns are considered to last anywhere from a couple of weeks to several months.
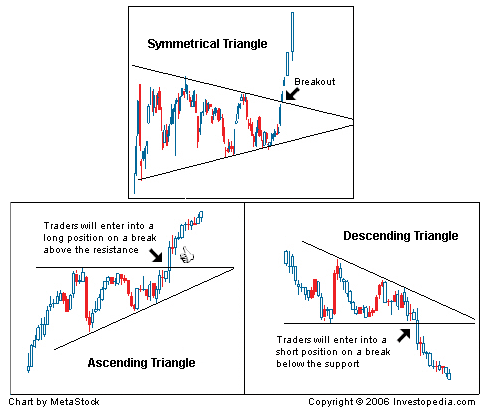
The symmetrical triangle in Figure 4 is a pattern in which two trendlines converge toward each other. This pattern is neutral in that a breakout to the upside or downside is a confirmation of a trend in that direction. In an ascending triangle, the upper trendline is flat, while the bottom trendline is upward sloping. This is generally thought of as a bullish pattern in which chartists look for an upside breakout. In a descending triangle, the lower trendline is flat and the upper trendline is descending. This is generally seen as a bearish pattern where chartists look for a downside breakout.
In conclusion - this can go either way
- Forums
- ASX - By Stock
- GXY
- General: Share Price, Trades and chart related discussions
General: Share Price, Trades and chart related discussions, page-413
-
-
- There are more pages in this discussion • 2,911 more messages in this thread...
You’re viewing a single post only. To view the entire thread just sign in or Join Now (FREE)


