Hello IAM community:
I'd like invite the team to make use of info below to estimate the progressive MC of IAM.
Best example of future valuation, is Paycom Software, imo.
(Class1, asx, CL1 , in financial planning business , is a close second)
Payc is classified as a Financial SaaS ,by Raymond James , USA.
Here are a some vital background info:
1) Raymond James
premier Fintech Investment house in US
a) Who is RJ
http://www.raymondjames.com/corpora...banking/pdfs/financial_sponsors_quarterly.pdf
b) ‘Financial SaaS’
“Fintech Monthly’, Sept2016, pg 27 ,
includes Paycom Software - PAYC and Xero ,
https://www.raymondjames.com/corporations_institutions/investment_banking/pdfs/fin_tech_monthly.pdf
2) PAYC , Paycom Software:
A) PE ratio
PE = 102 , based on actual Npat, latest Fin. Year
PE = 78, based on forward f/c Npat in 12 months
(EPY, YoY growth has been >70%, for last 3 years.
Hence analysts are prepare to adopt a higher PE)
PE = 48, based on forward f/c Npat in 24 months
http://www.nasdaq.com/symbol/payc/pe-ratio
http://www.nasdaq.com/symbol/payc/pe-growth-rates
http://www.nasdaq.com/symbol/payc/earnings-growth
B) NPATs (Net Incomes in USA) ,
actual, last 3 years
US$0.6m, US$6m, $20m
http://www.nasdaq.com/symbol/payc/financials?query=income-statement
C) Market Cap
MC is based on forward looking NPATs , 12-24 months
PE 78 x US$40m = >$3 Billion
3) PEG Ratio & PE
Look at the PEG Ratio - CFA Institute Blogs
Aug 16, 2012 - In his book One Up on Wall Street, Peter Lynch (2000) wrote,
“The p/e ratio of any company that’s fairly priced will equal its growth rate” (p. 199).
4) Profits Growth Rates
NPAT growth or more specifically EPS growth:
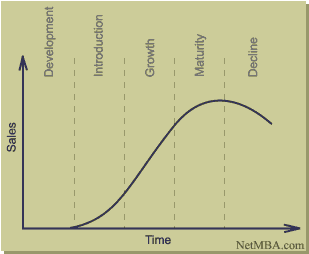
They are usually highest in the first 3-5 years of a start up.
100%, 200%,300% - Year on Year (YoY) growth is common .
http://www.netmba.com/marketing/product/lifecycle/
4) IAM
EPS growth, YoY, for next 3 years is expected to be >100%
That means it deserve a high PEs
5) Market Cap and Share Price
Can I invite
@9521 ,
Perth - @Pinkie38 and @forrestfield
Brisbane - @soalexx and @ffxssj
Sydney - Myself and @Odyssey360 and @Bodhi_Trader
Melbourne - @Divineinferno
and any other IAMer interested,
to recalculate possible MC and SP, based on your Revenues, NPATs estimates and a more appropriate PE ratios.
Thank you all in advance.
Cheers
G
-------
PS
1 @SeeThru
Can you please scan page 27 , "Financial SaaS" and highlight
Paycom Software
the whole row, with yellow highlight
https://www.raymondjames.com/corporations_institutions/investment_banking/pdfs/fin_tech_monthly.pdf
2 . Share Register
If we have half a dozen funds or high profile investors as SHHs, plus tighter register, IAM sp will be higher than what it is today.
Mr P.Canion, can you please note this point ( raised by more than one shh) and talk to the directors.
Thank you
G
- Forums
- ASX - By Stock
- CF1
- Summary of all investor Seminars - The next chapter
CF1
complii fintech solutions ltd
Add to My Watchlist
0.00%
 !
2.4¢
Summary of all investor Seminars - The next chapter, page-13
Featured News
Add to My Watchlist
What is My Watchlist?
A personalised tool to help users track selected stocks. Delivering real-time notifications on price updates, announcements, and performance stats on each to help make informed investment decisions.
 (20min delay) (20min delay)
|
|||||
|
Last
2.4¢ |
Change
0.000(0.00%) |
Mkt cap ! $13.71M | |||
| Open | High | Low | Value | Volume |
| 2.4¢ | 2.7¢ | 2.4¢ | $13.86K | 573.5K |
Buyers (Bids)
| No. | Vol. | Price($) |
|---|---|---|
| 1 | 200000 | 2.2¢ |
Sellers (Offers)
| Price($) | Vol. | No. |
|---|---|---|
| 2.6¢ | 500000 | 1 |
View Market Depth
| No. | Vol. | Price($) |
|---|---|---|
| 1 | 200000 | 0.022 |
| 1 | 250000 | 0.021 |
| 2 | 73125 | 0.020 |
| 3 | 912562 | 0.015 |
| 1 | 70000 | 0.014 |
| Price($) | Vol. | No. |
|---|---|---|
| 0.026 | 500000 | 1 |
| 0.028 | 506514 | 2 |
| 0.029 | 113723 | 1 |
| 0.030 | 500000 | 1 |
| 0.039 | 110820 | 1 |
| Last trade - 14.44pm 04/07/2025 (20 minute delay) ? |
Featured News
| CF1 (ASX) Chart |
The Watchlist
NUZ
NEURIZON THERAPEUTICS LIMITED
Dr Michael Thurn, CEO & MD
Dr Michael Thurn
CEO & MD
SPONSORED BY The Market Online


