Anyway, property has always beaten gold in the long run, and your chart won't take into account the income or rent.
On your chart, in 2012 it took 280 oz to buy a house, now it takes 380.
Correct chart doesn't show any "income" (or tax paid if not negatively geared)...the chart also doesn't take into account the holding costs of property...i.e...rates, insurances, utilities, repairs & maintenance etc.
If you look at the AU house/gold oz chart it is clear to see there was a correction in property prices at the 280 oz period you pointed out...and then further gains in property prices as per current 380 oz ratio....however the ratio appears to be in a long term down trend to me.
Houses purchased for 50 oz gold (or 750 oz silver at 15:1 historical ratio) coming up again in the future....???
Certainly a possibility...just like your $800 gold call could eventuate depending on future "events"...
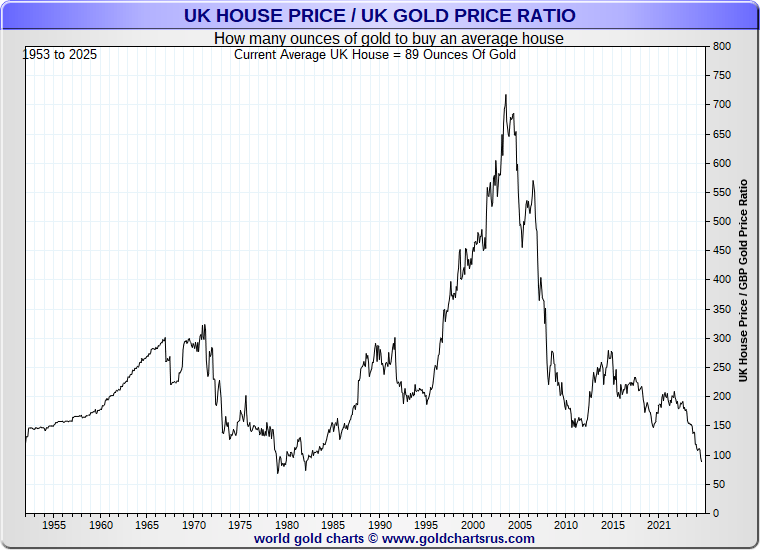
btw...average UK house price GBP chart in gold oz below just to confirm that the AU charts aren't an anomaly.