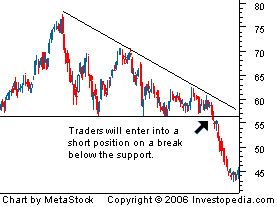
DEFINITION of 'Descending Triangle'
A bearish chart pattern used in technical analysis that is created by drawing one trendline that connects a series of lower highs and a second trendline that has historically proven to be a strong level of support. Traders watch for a move below support, as it suggests that downward momentum is building. Once the breakdown occurs, traders enter into short positions and aggressively push the price of the asset lower. The chart below is an example of a descending triangle:
BREAKING DOWN 'Descending Triangle'
This is a very popular tool among traders because it clearly shows that the demand for an asset is weakening, and when the price breaks below the lower support, it is a clear indication that downside momentum is likely to continue or become stronger. Descending triangles give technical traders the opportunity to make substantial profits over a brief period of time. The most common price targets are generally set to equal the entry price minus the vertical height between the two trendlines.
A descending triangle is the bearish counterpart of an ascending triangle.
Read more: Descending Triangle http://www.investopedia.com/terms/d/descendingtriangle.asp#ixzz4pDHhXL1G

News: VRC Volt Resources appoints Asimwe Kabunga as chairman, page-93


Add VRC (ASX) to my watchlist
 (20min delay) (20min delay)
|
|||||
|
Last
0.4¢ |
Change
0.000(0.00%) |
Mkt cap ! $16.63M | |||
| Open | High | Low | Value | Volume |
| 0.0¢ | 0.0¢ | 0.0¢ | $0 | 0 |
Buyers (Bids)
| No. | Vol. | Price($) |
|---|---|---|
| 39 | 70079358 | 0.3¢ |
Sellers (Offers)
| Price($) | Vol. | No. |
|---|---|---|
| 0.4¢ | 8328211 | 12 |
View Market Depth
| Last trade - 16.12pm 09/10/2024 (20 minute delay) ? |
| VRC (ASX) Chart |
Day chart unavailable