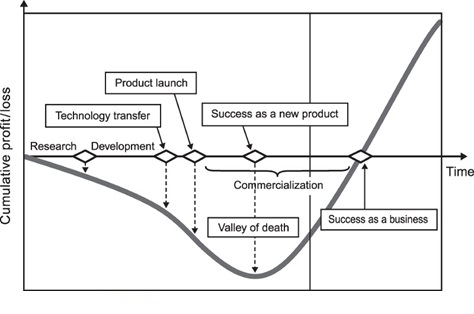
The Death Valley Curve refers to the span of time from when a start up firm needs capital until it starts generating revenues. Additional financing during this phase becomes extremely difficult as the start-up has not yet started generating revenues. At such times, this leaves start-ups with inadequate cash flow. This curve is called the Death Valley Curve, as start-ups in this phase are the most vulnerable to failure and death.
As you can see from the following graph, EDE & EdenCrete (and TAS) are right at the bottom of this “Valley of Death”.
IMHO GS, the BOD and the EdenCrete team are managing this Death Valley phase extremely well.
This latest successful CR should mark the point at which EDE & EdenCrete (and TAS) leave this extremely dangerous phase behind.
Wishing you all a good day!
MB
Please Note: Readers must do their own research before making any investment decisions. Posts from me are my own personal opinion. They are not intended to be a recommendation to buy, sell or hold.
- Forums
- ASX - By Stock
- EDE
- Ann: Capital Raising Update
Ann: Capital Raising Update, page-189
-
-
- There are more pages in this discussion • 38 more messages in this thread...
You’re viewing a single post only. To view the entire thread just sign in or Join Now (FREE)
Featured News
NEWS
Week 31 Wrap: JORC rules to get tougher; RBA rate hike chance 50/50; US Fed Sept cut still the quo
BOE
Uranium prices on the NYMEX are stable, but ASX uranium stocks are sinking on Friday. The answer lies in Kazakhstan
DVP
Commodity house Trafigura funds Develop Global's copper-zinc Woodlawn play with offtake deal in place
NEWS
Is oil undervalued?
Add EDE (ASX) to my watchlist
(20min delay)
|
|||||
Last
0.2¢ |
Change
0.000(0.00%) |
Mkt cap ! $7.427M |
Open | High | Low | Value | Volume |
0.2¢ | 0.2¢ | 0.2¢ | $0 | 20 |
Buyers (Bids)
No. | Vol. | Price($) |
---|---|---|
54 | 165677452 | 0.1¢ |
Sellers (Offers)
Price($) | Vol. | No. |
---|---|---|
0.2¢ | 18123690 | 17 |
View Market Depth
No. | Vol. | Price($) |
---|---|---|
54 | 165677452 | 0.001 |
0 | 0 | 0.000 |
0 | 0 | 0.000 |
0 | 0 | 0.000 |
0 | 0 | 0.000 |
Price($) | Vol. | No. |
---|---|---|
0.002 | 18123690 | 17 |
0.003 | 52378349 | 31 |
0.004 | 5341034 | 5 |
0.006 | 1500000 | 1 |
0.007 | 50000 | 1 |
Last trade - 10.02am 07/08/2024 (20 minute delay) ? |
Featured News
EDE (ASX) Chart |