Good stuff Voltaire - my SPX data only goes back to 1987, so your chart was a revelation.
In December I originally had 1385 as the line in the sand based on the recent bull market.
You suggest 1290 as the line in the sand based on the 1982/2007 move. Looking at your chart, I agree it seems extremely important.
SPX has twice traded below 1290 recently (22 and 23 January 2008) so another break of 1290 wouldn't surprise.
In favour of SPX holding firm and rebounding is it's late January test and rebound from 1267: the 38.2% retracement of the Oct 2002/Oct 2007 move.
I'm short SPX and wouldn't be surprised at a minimum retrace to the 50% level. I think downside targets of 1172 (50%) or 1077 (61.8%) are quite possible.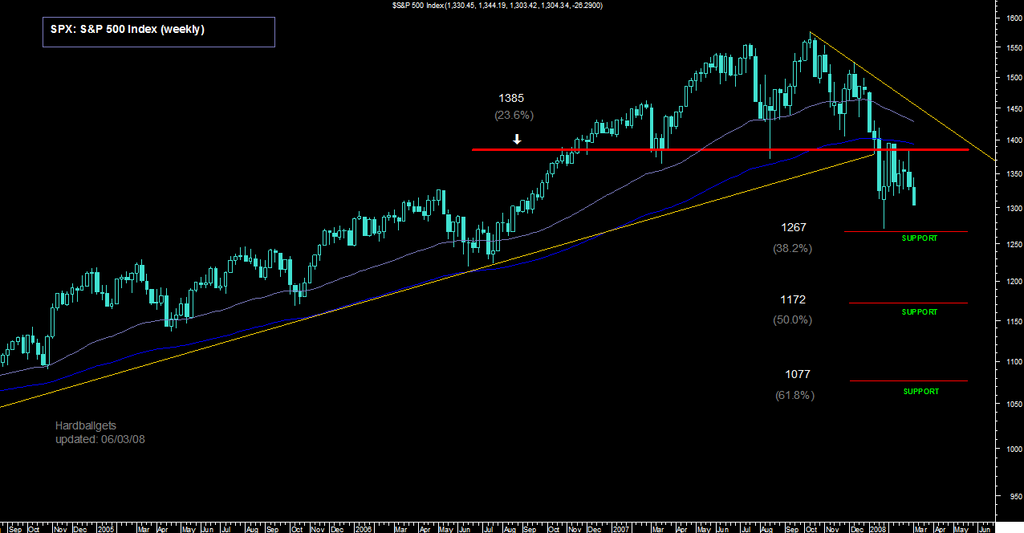


Add to My Watchlist
What is My Watchlist?
 (20min delay) (20min delay)
|
|||||
|
Last
8,757.2 |
Change
118.200(1.37%) |
Mkt cap ! n/a | |||
| Open | High | Low |
| 8,639.0 | 8,776.4 | 8,639.0 |
| XJO (ASX) Chart |