here are 2 very simple charts showing the long term trends in oil and the DOW. Note how when oil broke to the down side (9/06 to 6/07) the DOW broke to the upside. That was a golden patch (oh, i miss those days). Oil returned to it's long term trend and the DOW corrected but now it's old upper channel trend line is support. IE we are not in a bear market yet IMHO. The big jan fall was just a bull market correction.
But now oil has broken out... way out to the upside. If it now follows as it did when oil went down that the DOW is about to break out to the opposite side then things may start to get really scarey.
Hope for a miracle that oil has peaked and it starts coming down from here on it's own accord....but I'm not holding my breath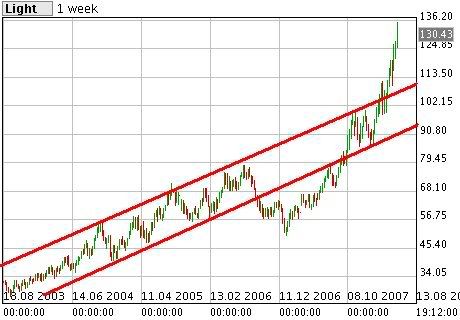


Add to My Watchlist
What is My Watchlist?
 (20min delay) (20min delay)
|
|||||
|
Last
8,580.1 |
Change
-9.100(0.11%) |
Mkt cap ! n/a | |||
| Open | High | Low |
| 8,589.2 | 8,619.8 | 8,568.2 |
| XJO (ASX) Chart |