chalea, that h&s is starting to become a little less convincing after the 13.5c dip today. I expressed a bit of concern the other day to Maxaction over the pattern because of the sloping neckline....after today I am even more concerned.
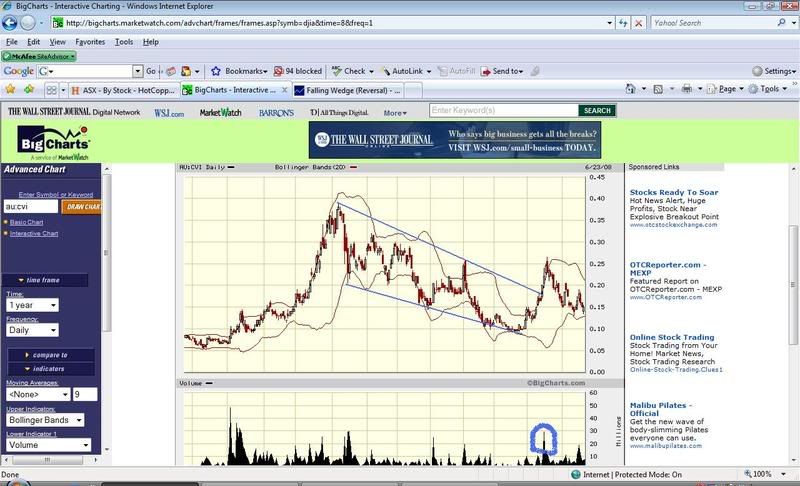
I have been studying the CVI chart tonight. I realized that from the previous 39c high until the breakout in early may was a perfect textbook falling wedge complete with rising volume at breakout. I am wondering if we are not seeing another one form. They are bullish but this one would need another 1.5 months formation at least to qualify. (but i want to br rich tomorrow :( ) Still, at least it's bullish...
I think we need some more peaks and troughs first before we decide...
falling wedges link http://stockcharts.com/school/doku.php?id=chart_school:chart_analysis:chart_patterns:falling_wedge_revers
chart, page-19
-
- There are more pages in this discussion • 31 more messages in this thread...


You’re viewing a single post only. To view the entire thread just sign in or Join Now (FREE)