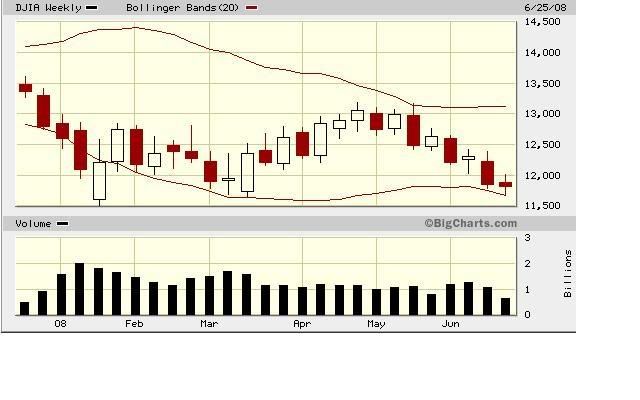
for fans of the bollinger band :
it would seem to me for an index to venture outside the bollinger band on the weekly chart is a rare and extreme event. More often it seems to be the case that touching a weekly bollinger extremity is the event that triggers a trend shift....even if the shift is only to sideways.
in march that is what happened...no breaching of the weekly bollinger did we see. January was different however with the DOW falling well outside the band. If we are currently doing "a january" then we should see an intra week low next week. roughly that may be at around 11000. Some of the newsletters I have emailed to me suggest that if 11750 failed then 11000 was it.
BTW it seems bigcharts haven't as yet updated the weekly chart today but it doesn't take much to join the dots


Add to My Watchlist
What is My Watchlist?
 (20min delay) (20min delay)
|
|||||
|
Last
8,737.2 |
Change
60.000(0.69%) |
Mkt cap ! n/a | |||
| Open | High | Low |
| 8,677.2 | 8,748.6 | 8,677.2 |
| XJO (ASX) Chart |