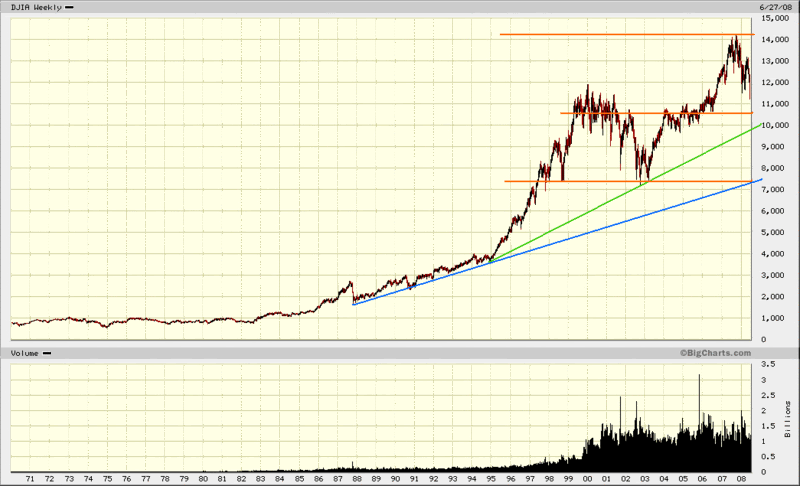
I have given some more thought to ciggy's question today as to where a full blown crash may take us. firstly can i say again things are different this time. The fed has used up their silver bullets and have nothing left up their sleeves. If we look at previous dips on the chart the day was saved when the fed rode in with big rates cuts. we have been their and done that. all that is left now is for the US market to correct itself to true fair value.
Chalea put up a chart today and put a good case for 10600 as the ultimate low. I have taken a longer term view of the DOW and find further evidence to support Chalea's case more or less. If we consider the rise from the low of 2002 to the top of the market in 2007 10700 is about the 50% retrace point. there is also long term support/resistance at this level going right back to 1997.
having said that can i say when this down leg first started i suggested that this was a full blown correction and I was dismissed by many of my colleagues. but i had many charts with pretty coloured lines and lots of good arguments suggesting a low of 11600. In my defence the market did stall last week for 3 days just above this level before smashing straight through. Obviously I had correctly identified a support point but it didn't hold.
So if chalea's 10600/10700 were to fail i see next long term support at around 9800 (the green line) going back to when the DOW fully broke out in 1995. There is another XJO regular who suggested this level using elliot waves but i can't remember who he is or how he arrived at it.
The blue line at around 7200 is the scariest by far but maybe not as unrealistic as you may think and is certainly very interesting. It is the long term trend line starting from the 87 crash. but it is also currently intersecting with the long term support line at 7300 where the last bull run started from in 2002. I remember doing a 4 day stock market course in 2003 at the asx. One lecturer started by telling us that markets move in 30 year cycles. 15 years up and then 15 years sideways. he said that even though we are now in the sideways phase we would have plenty of bull legs in the coming years (as we have just been through). Voltaire on the XJO thread speaks of something similar but he uses 17 years up and 17 sideways. If we consider that the DOW moved relentlessly from 1982 to 1999 in a bull leg peaking at around Chalea's 10700 and then oscillating sideway around this level for about 2.5 years. we then fell to the lows of 2002 and 2003 at around 7200 and returned to oscillate again for 2 more years around 10700. We then made an equal and opposite break to the upside to 14200 and now find ourselves heading back to 10700. But if economies really do move sideways for 17 years, and if history since 1999 has shown us the sideways trading channel then i think it is reasonable to expect the possibility that at some point before 2016 we could see the DOW revisit 7200. to us now this seems inconceivable but in effect could be just natural market action.
what happens next is anyones guess. maybe we will hit 10700 and ocsillate around that point sideways again for another couple of years followed by another down leg to 7200 or maybe we will just crash straight through or maybe we will bounce off 10700 and continue back up. we shall just have to wait and see....
- Forums
- ASX - By Stock
- DJIA
- whats wrong with this picture
whats wrong with this picture, page-32
-
- There are more pages in this discussion • 31 more messages in this thread...
You’re viewing a single post only. To view the entire thread just sign in or Join Now (FREE)
Featured News
Add DJIA (INDEXDJX) to my watchlist
 (20min delay) (20min delay)
|
|||||
|
Last
26,683 |
Change
82.730(0.31%) |
Mkt cap ! n/a | |||
| Open | High | Low |
| 26,683 | 0.00 | 0.00 |


