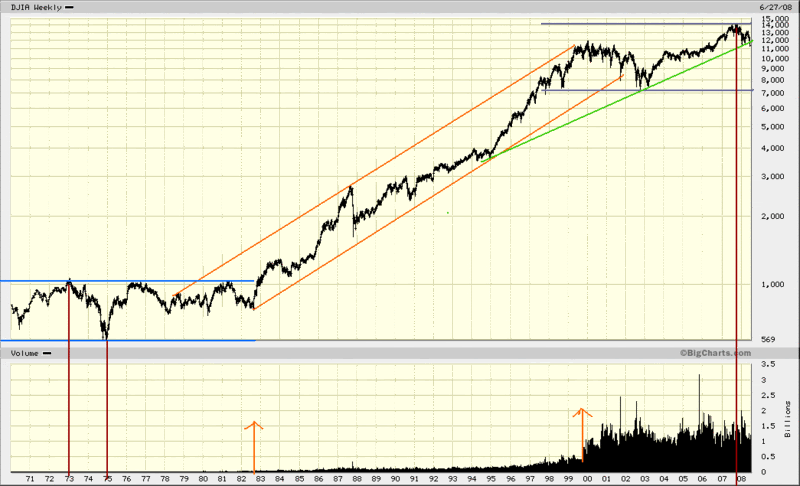
Especially just for Redcorduroy.....a log chart
I concede that the meaning of my longterm trend lines change somewhat on a log scale....the line going back to the 87 crash becomes meaningless and the support going back to 1995 has been breached as from the last couple of days !!! The picture of where we are at does not change but the log scale does highlight some interesting features not clearly visable on a linear scale.
I have used all data available from big charts. we can clearly see the end of the last 17 consoldition trading channel, the 17 up years trading channel (late 82- late 99) and the current 17 year consolidation channel to date. Using the log scale we can get a clear idea of the impact of the 74 correction in relative terms and where we are today in relation to that part of the cycle. I also think the log scale clearly shows the width of the sideways channel that we could only catch a glimpse of using linear. the log scale enhances my belief a return over the next year to the low 7000's is a distinct possibility.
Thank you redcorduroy....you have provided an interesting perspective.
and oh snacks, i think you may be right. this may be a very exciting time for those willing to move with the times. IMHO the buy and hold types COULD be dead in the water soon. We are not in the same market we have been in...
- Forums
- ASX - By Stock
- DJIA
- whats wrong with this picture
whats wrong with this picture, page-41
-
- There are more pages in this discussion • 22 more messages in this thread...
You’re viewing a single post only. To view the entire thread just sign in or Join Now (FREE)
Featured News
Add DJIA (INDEXDJX) to my watchlist
 (20min delay) (20min delay)
|
|||||
|
Last
26,683 |
Change
82.730(0.31%) |
Mkt cap ! n/a | |||
| Open | High | Low |
| 26,683 | 0.00 | 0.00 |
Featured News
The Watchlist
3DA
AMAERO INTERNATIONAL LTD
Hank Holland, Executive Chairman and CEO
Hank Holland
Executive Chairman and CEO
Previous Video
Next Video
SPONSORED BY The Market Online


