backfilling that gap
which BHP may do on oseas markets may mean the neck line is mended but as it stands TA pundits may agree the Head and Shoulders neckline was broken yesterday. The potential is arrowed... corrections and comments welcome.
T10 I may not have given you the correct TA info, my apologies
but I know you are very aware of opposing fundamentals of the offer...this chart HandS pattern is largely academic..
however the Ichymoku indicators have back tested very well imo
john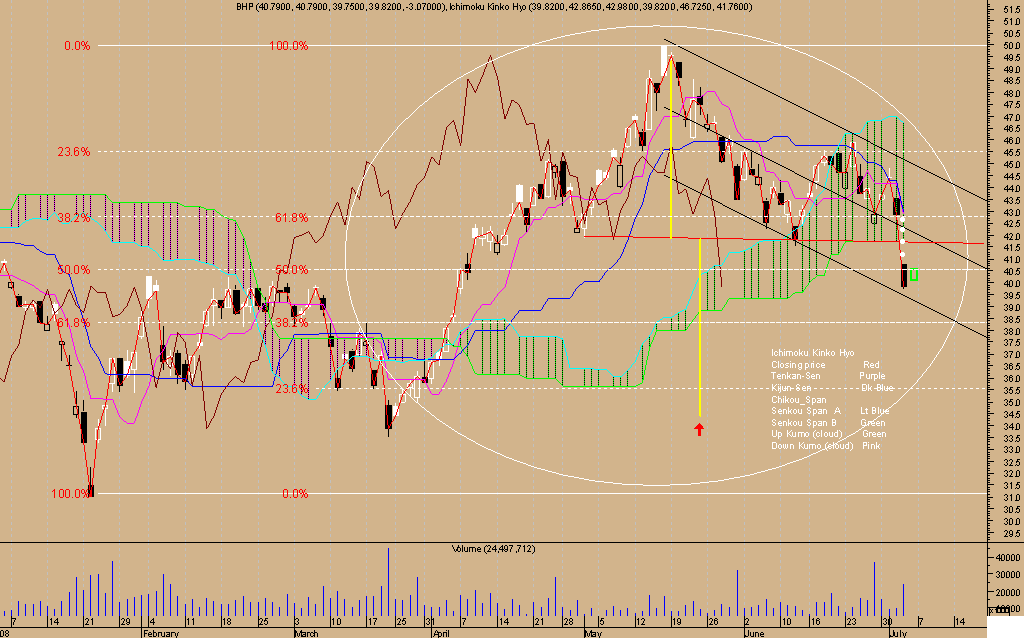


Add to My Watchlist
What is My Watchlist?
 (20min delay) (20min delay)
|
|||||
|
Last
$36.48 |
Change
0.840(2.36%) |
Mkt cap ! $185.1B | |||
| Open | High | Low | Value | Volume |
| $36.45 | $36.60 | $36.10 | $321.8M | 8.837M |
Buyers (Bids)
| No. | Vol. | Price($) |
|---|---|---|
| 1 | 8 | $36.47 |
Sellers (Offers)
| Price($) | Vol. | No. |
|---|---|---|
| $36.49 | 869 | 2 |
View Market Depth
| Last trade - 16.17pm 24/06/2025 (20 minute delay) ? |
| BHP (ASX) Chart |