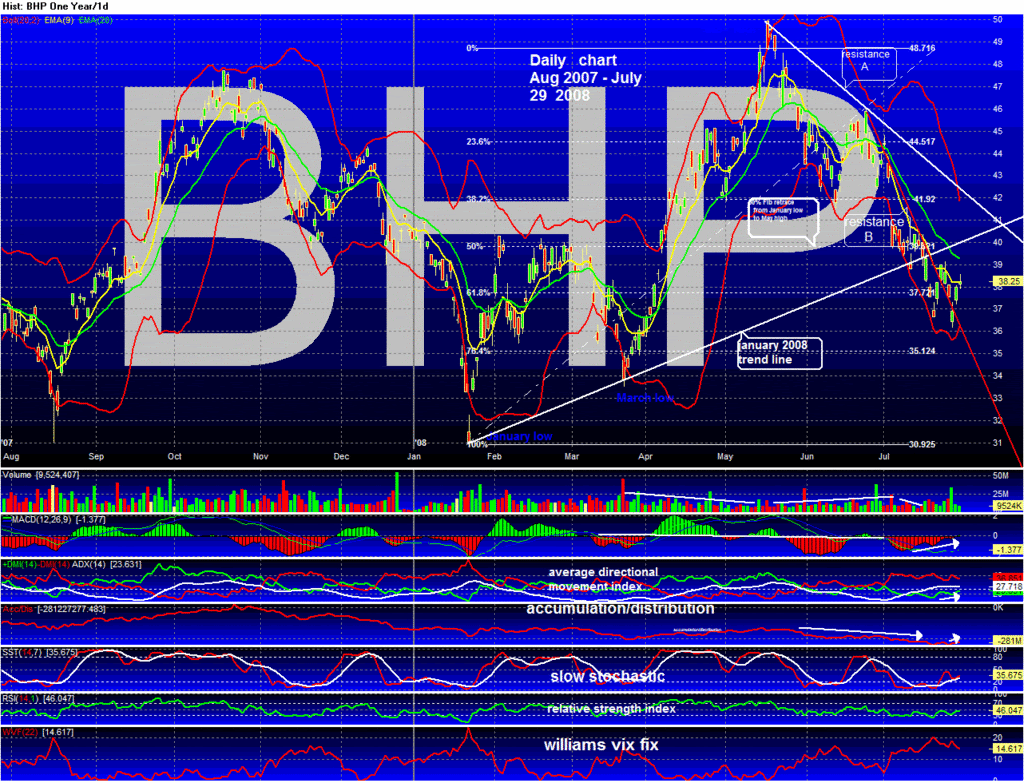
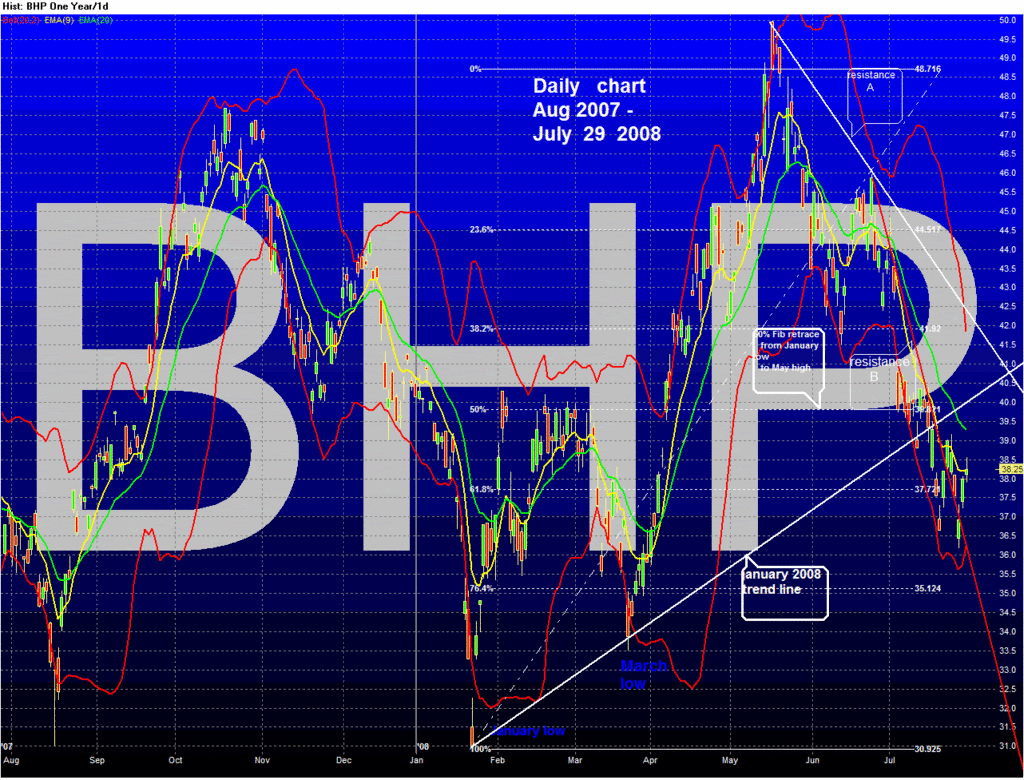
The daily chart shows some promise, but worryingly below major support lines. For a breakout into the 40's we have to do better!
-SP is above 61.8% Fibo (around $37.70)--good
-Dead on 9-day Exponential Moving Average
-Above short term RED reistance Line B -good
-Below January WHITE support line -bad
-well, well below WHITE Resistance Line A -bad
-MACD histogram is green -great, promising
-average directional movement index trend is weak
-accumulation/distribution very low, money still flowing out but has turned upwards
--Slow Stochastic kissed signal line, but no tongue!
-relative strength index at 46 is average, and heading up-good
-Williams Vix Fix trending down from danger level of 20, so volatility is abating -good
- Forums
- ASX - By Stock
- BHP
- todays chart
todays chart
-
-
- There are more pages in this discussion • 17 more messages in this thread...
You’re viewing a single post only. To view the entire thread just sign in or Join Now (FREE)
Featured News
Add BHP (ASX) to my watchlist
 (20min delay) (20min delay)
|
|||||
|
Last
$39.92 |
Change
0.710(1.81%) |
Mkt cap ! $202.5B | |||
| Open | High | Low | Value | Volume |
| $40.07 | $40.25 | $39.87 | $277.0M | 6.742M |
Buyers (Bids)
| No. | Vol. | Price($) |
|---|---|---|
| 47 | 5764 | $39.92 |
Sellers (Offers)
| Price($) | Vol. | No. |
|---|---|---|
| $39.93 | 4032 | 16 |
View Market Depth
| No. | Vol. | Price($) |
|---|---|---|
| 12 | 1656 | 39.890 |
| 15 | 6685 | 39.880 |
| 12 | 6438 | 39.870 |
| 9 | 2747 | 39.860 |
| 16 | 7508 | 39.850 |
| Price($) | Vol. | No. |
|---|---|---|
| 39.900 | 1466 | 8 |
| 39.910 | 3746 | 8 |
| 39.920 | 4391 | 22 |
| 39.930 | 4399 | 16 |
| 39.940 | 9382 | 16 |
| Last trade - 14.00pm 16/08/2024 (20 minute delay) ? |
Featured News
| BHP (ASX) Chart |


