Lol, too colllllllld for a BBQ down south, Robb.
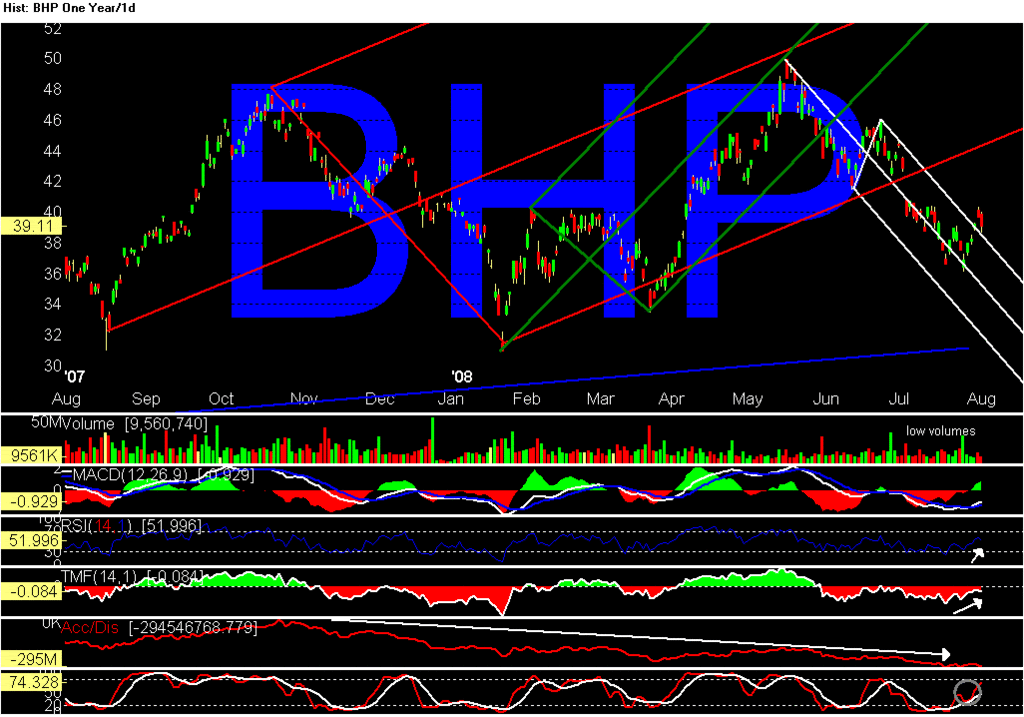
Here's some charting fun with Andrews Pitchforks.
The big red one shows, in retrospect, I guess, how weak the uptrend from August last year to the May high was -- never broke through the middle line.
But it did ---in retrospect, again, lol--- project that high.
The green pitchform from January this year, again shows prices stayed in the lower channel, so the trend was not spectacular.
The white pitchform downtrend is a little more promising in that prices are bouncing off the centreline and staying within or breaking out of the upper channel.
Lower blue line is the support from 2005.
- Forums
- ASX - By Stock
- BHP
- down almost 6 percent in new york
BHP
bhp group limited
Add to My Watchlist
2.60%
 !
$41.51
down almost 6 percent in new york, page-13
Featured News
Add to My Watchlist
What is My Watchlist?
A personalised tool to help users track selected stocks. Delivering real-time notifications on price updates, announcements, and performance stats on each to help make informed investment decisions.
 (20min delay) (20min delay)
|
|||||
|
Last
$41.51 |
Change
1.050(2.60%) |
Mkt cap ! $210.7B | |||
| Open | High | Low | Value | Volume |
| $40.89 | $41.69 | $40.77 | $470.8M | 11.38M |
Buyers (Bids)
| No. | Vol. | Price($) |
|---|---|---|
| 3 | 1473 | $41.50 |
Sellers (Offers)
| Price($) | Vol. | No. |
|---|---|---|
| $41.51 | 171 | 1 |
View Market Depth
| No. | Vol. | Price($) |
|---|---|---|
| 3 | 1473 | 41.500 |
| 2 | 121 | 41.410 |
| 1 | 86 | 41.380 |
| 1 | 250 | 41.360 |
| 2 | 512 | 41.350 |
| Price($) | Vol. | No. |
|---|---|---|
| 41.510 | 171 | 1 |
| 41.530 | 29400 | 2 |
| 41.550 | 9204 | 8 |
| 41.560 | 1072 | 3 |
| 41.580 | 500 | 2 |
| Last trade - 16.18pm 22/07/2025 (20 minute delay) ? |
Featured News
| BHP (ASX) Chart |


