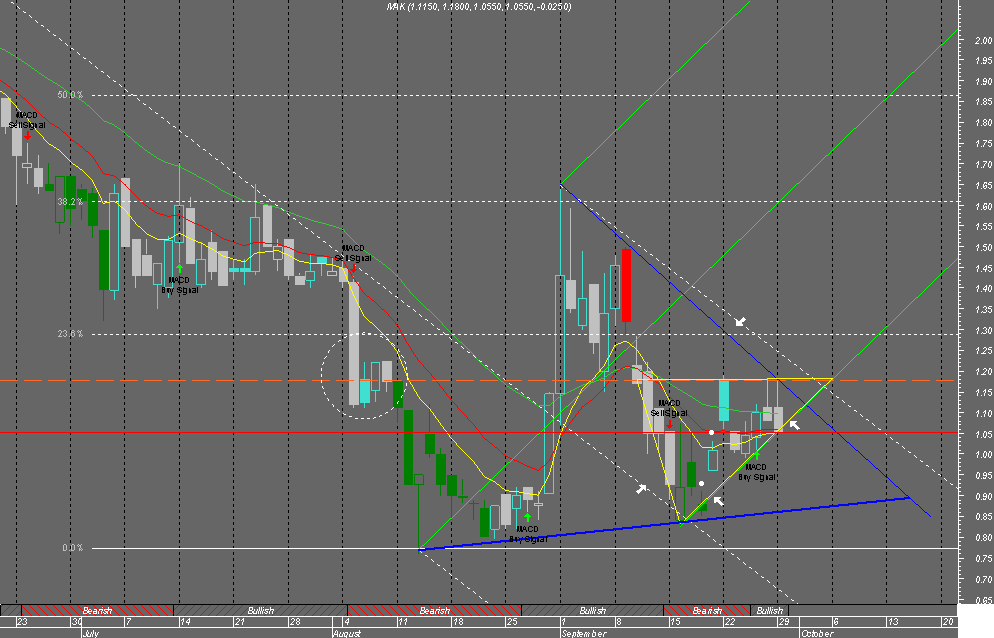
Oh well there ya go
To early was I...
105 should have been the stoploss..
goodluck
I hope the chart now makes sense of the previous comments
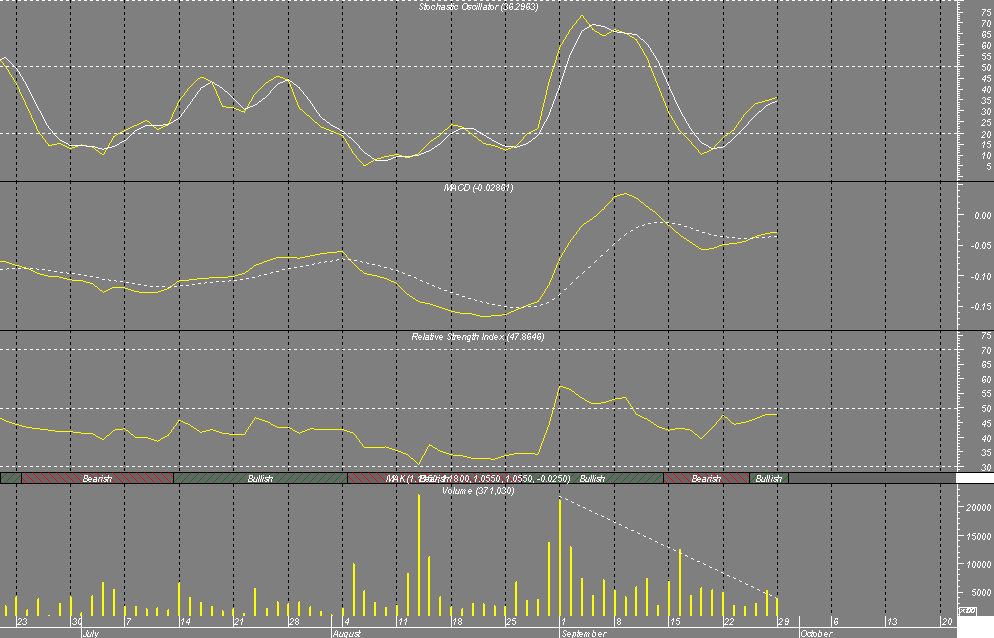
heres Sigma deltas RSI still holding.
Stochastics and MACD are still long..
TWEEZER TOP (BEARISH)
Tweezer Top is a top reversal pattern / bearish reversal pattern.
It could be formed at the end of an uptrend, or during a bounce within a downtrend, or at the resistance.
Tweezer Top is formed when two or more candlesticks touch identical tops (high price), and then the price drops lower.
The candlesticks can be composed of real bodies, shadows, and/or dojis.
Some possibilities of Tweezer Top pattern:
* Two real candlestick bodies with the same high price.
* The upper shadows of two consecutive candles (e.g. two Shooting Stars) touch an identical top level.
* The real body on the 1st day and the upper shadow (or doji’s high) of the following day hit the same high price.
* The upper shadow (or doji’s high) on the 1st day’s candle and the real body of the following day hit the same top level.
A Tweezer Top pattern is considered to be more significant when the two candlesticks that comprise the Tweezers pattern also form another candlestick reversal patterns.
For example:
If the two candlesticks of Harami Cross Bearish (or Harami Bearish) hit the same high price, it could be an important bearish reversal signal, as the same two candlesticks form a Tweezer Top as well as a Harami Cross Bearish (or Harami Bearish).
Tweezer Top implies that at the top level, bulls (buyers) were not able to drive the price higher. As a result, the pattern signifies a short-term resistance level and signals a possible turning point.
The price action immediately after the Tweezer Top candles should be watch carefully.
If the top / high price formed by the two candles is penetrated, then price is likely to increase to at least the next important resistance level.
If the top / high price hold, then the Tweezer Top may provide a potential reversal signal.
A confirmation should be needed in terms of the price to continue to drop and even close lower.
chart, page-13


Add AEV (ASX) to my watchlist
 (20min delay) (20min delay)
|
|||||
|
Last
0.7¢ |
Change
0.002(40.0%) |
Mkt cap ! $16.44M | |||
| Open | High | Low | Value | Volume |
| 0.5¢ | 0.7¢ | 0.5¢ | $108.8K | 18.32M |
Buyers (Bids)
| No. | Vol. | Price($) |
|---|---|---|
| 5 | 1010000 | 0.6¢ |
Sellers (Offers)
| Price($) | Vol. | No. |
|---|---|---|
| 0.7¢ | 4765243 | 9 |
View Market Depth
| Last trade - 13.53pm 23/07/2024 (20 minute delay) ? |
| AEV (ASX) Chart |