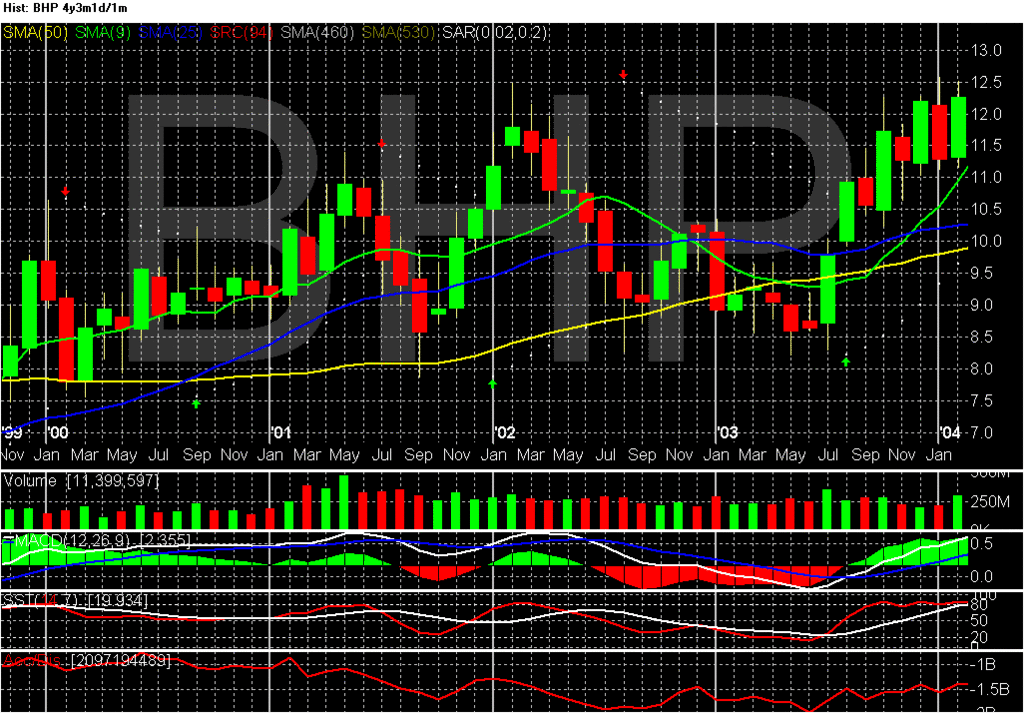
Yes, charts are good signposts to what is possible, what may or can happen.
Not necessarily what HAS to happen.
For instance, look at this monthly snapshot of BHP 2001-2003. Looks familiar? Head and shoulders, higher high in February 2002 than May 2001?
What happened next? Doom, gloom, back to an ancient much lower prices?
---Nope.
From 2003 began a bull run to the present.
- Forums
- ASX - By Stock
- BHP
- target thursday
target thursday , page-31
-
-
- There are more pages in this discussion • 40 more messages in this thread...
You’re viewing a single post only. To view the entire thread just sign in or Join Now (FREE)
Featured News
Add BHP (ASX) to my watchlist
 (20min delay) (20min delay)
|
|||||
|
Last
$40.94 |
Change
0.060(0.15%) |
Mkt cap ! $207.6B | |||
| Open | High | Low | Value | Volume |
| $41.13 | $41.24 | $40.86 | $262.2M | 6.390M |
Buyers (Bids)
| No. | Vol. | Price($) |
|---|---|---|
| 1 | 16 | $40.93 |
Sellers (Offers)
| Price($) | Vol. | No. |
|---|---|---|
| $40.95 | 1333 | 1 |
View Market Depth
| No. | Vol. | Price($) |
|---|---|---|
| 1 | 16 | 40.930 |
| 2 | 6750 | 40.900 |
| 2 | 9158 | 40.870 |
| 2 | 543 | 40.860 |
| 3 | 82 | 40.850 |
| Price($) | Vol. | No. |
|---|---|---|
| 40.950 | 1333 | 1 |
| 40.960 | 14486 | 1 |
| 40.970 | 15000 | 1 |
| 40.980 | 1100 | 2 |
| 40.990 | 1000 | 1 |
| Last trade - 16.10pm 22/08/2024 (20 minute delay) ? |
Featured News
| BHP (ASX) Chart |
The Watchlist
SS1
SUN SILVER LIMITED
Gerard O'Donovan, Executive Director
Gerard O'Donovan
Executive Director
SPONSORED BY The Market Online


