SeamFiend,
Good question..
People like Mad Max will say any stock is charitable at any time that's easy for him to say he a very good chartist and has been charting in Bull & Bear markets.
During the bear 2002/03 I found you really needed to look harder to see what the charts where saying, the 2 things that come in a bear is Volatility & Decreased Momentum imo.
But there are always stocks that do well in a bear it's a matter of picking the swings on the charts, I'd cringe at the thought of anyone in this market of not using to some degree charts that is why I'm trialling MA just looking for a edge.imo
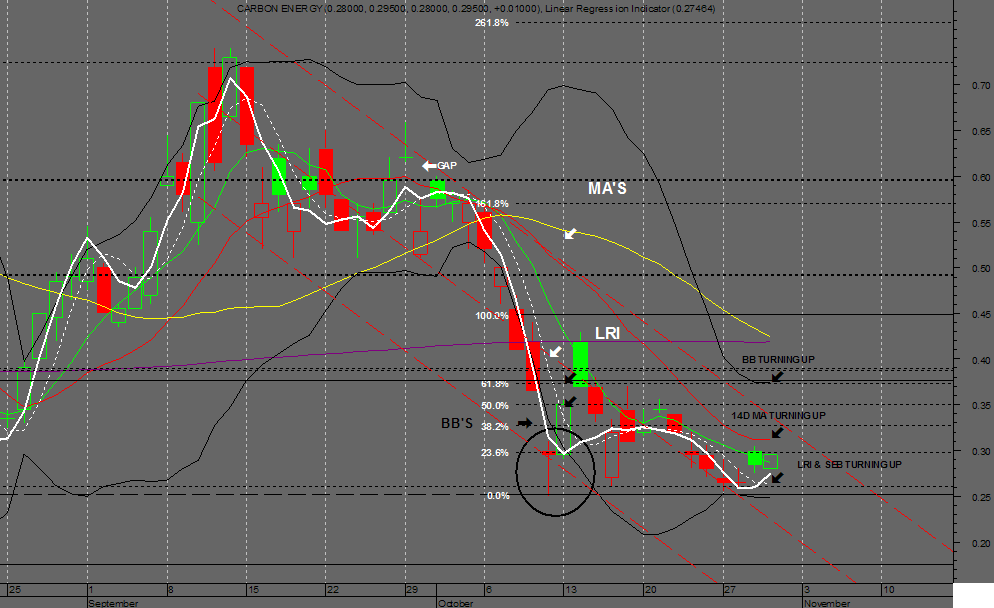
Note CNX Charts below first the daily all the Inds are turning up it just needs to break this little Fib projection @ j's 30c. imo.
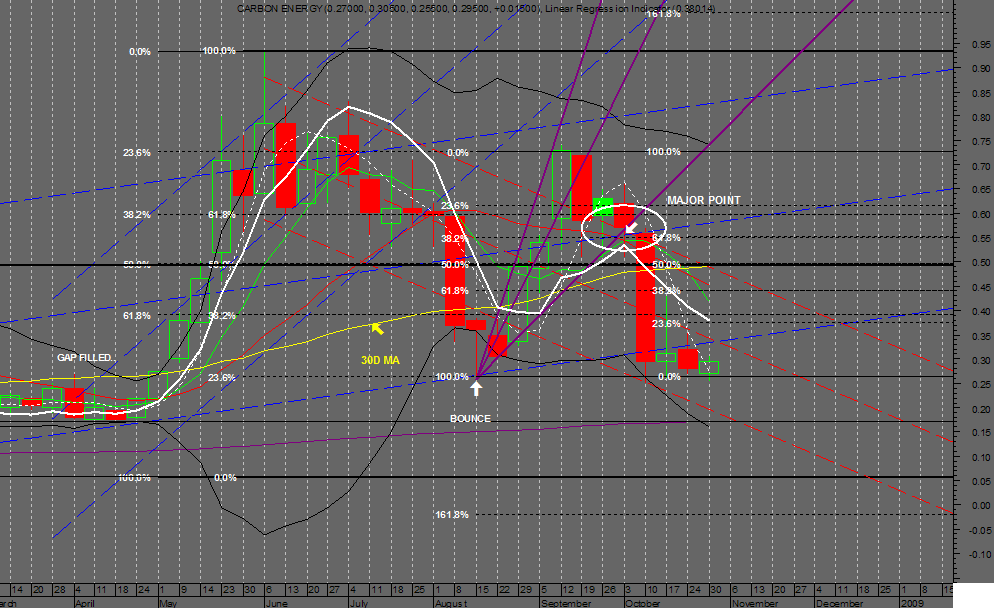
The Weekly Chart show's 5 bottoms @ 25/26c its trading below all MA's bar the 200d .
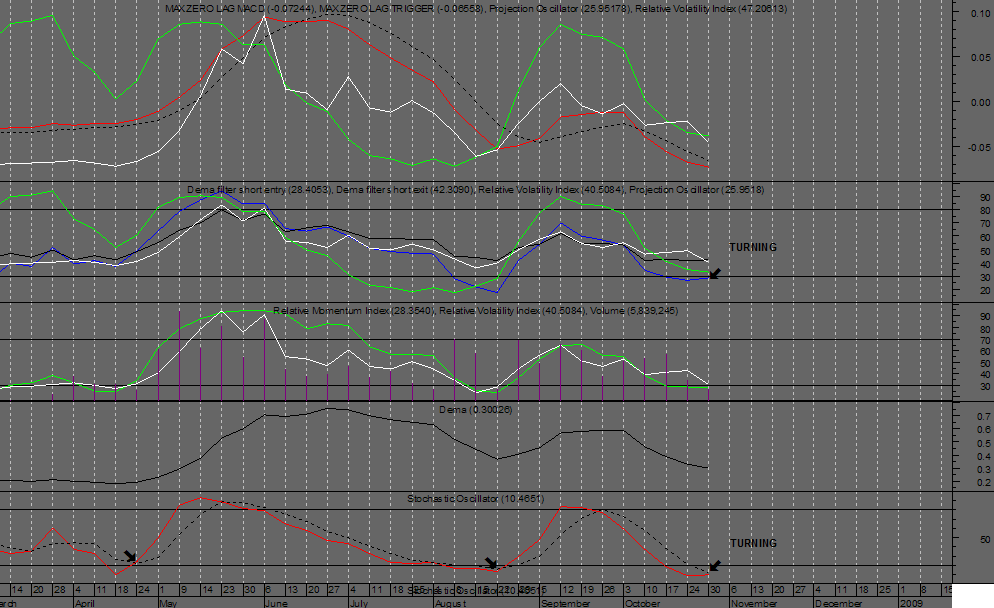
All the Ind's are well into oversold and are on the cusp of turning the Dema Short Entry in Blue has just turned along with the Stochastic's.
I'd expect a break fairly soon imo..
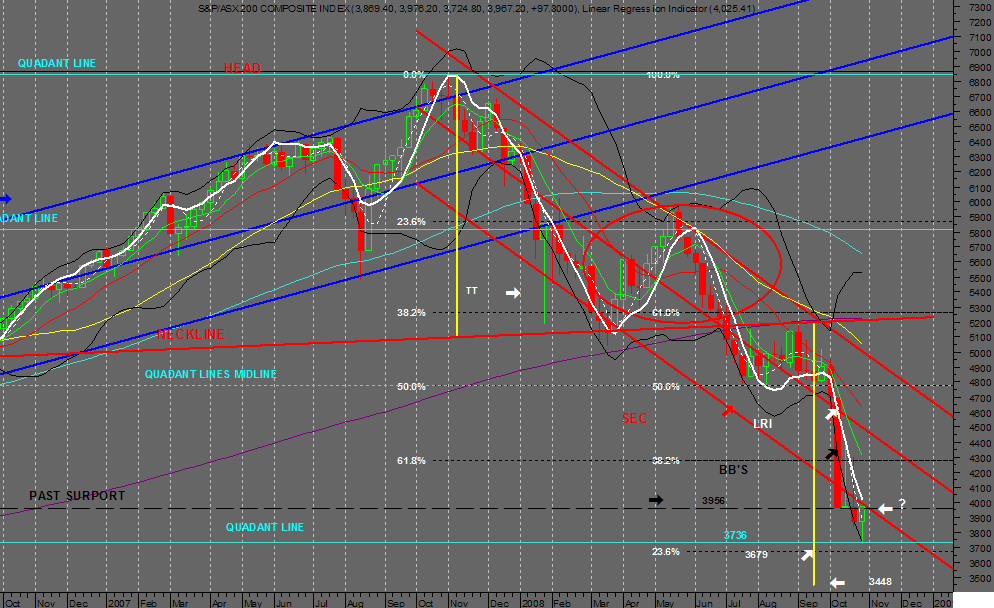
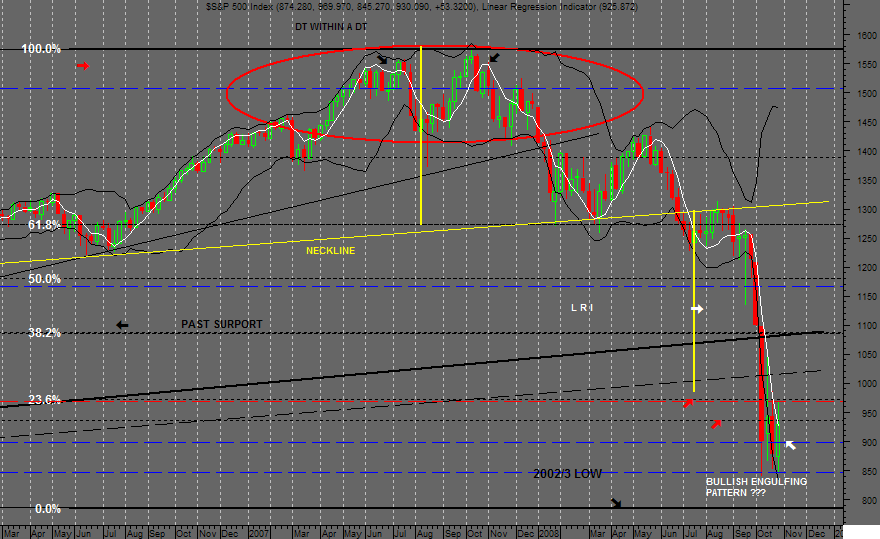
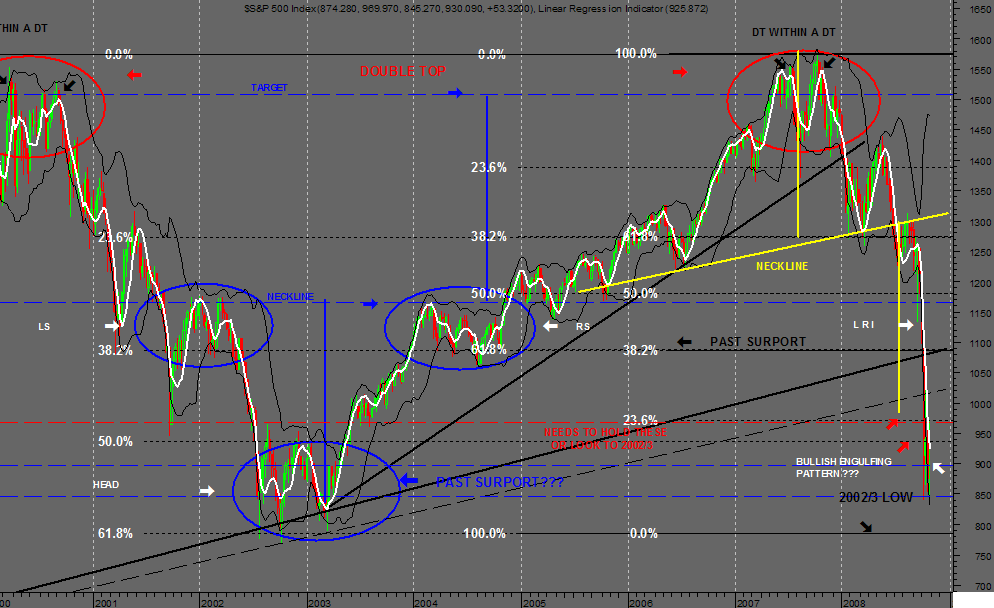
Note the XJO has bounced off a Quadrant line if you have a look at the Quadrant Midline it was good support for 11 weeks plus the S&P 500 has 4 weekly bottoms around 850 and may Finish the week with a Bullish Engulfing Candle Pattern, that means Volatility is slowing & we are at or close to bottom..imo.
Just my thoughs..
Cheers Pete.
Pps CJS Yes the Holy Grail I'm still look'n.
Thanks for that to Dark Cloud..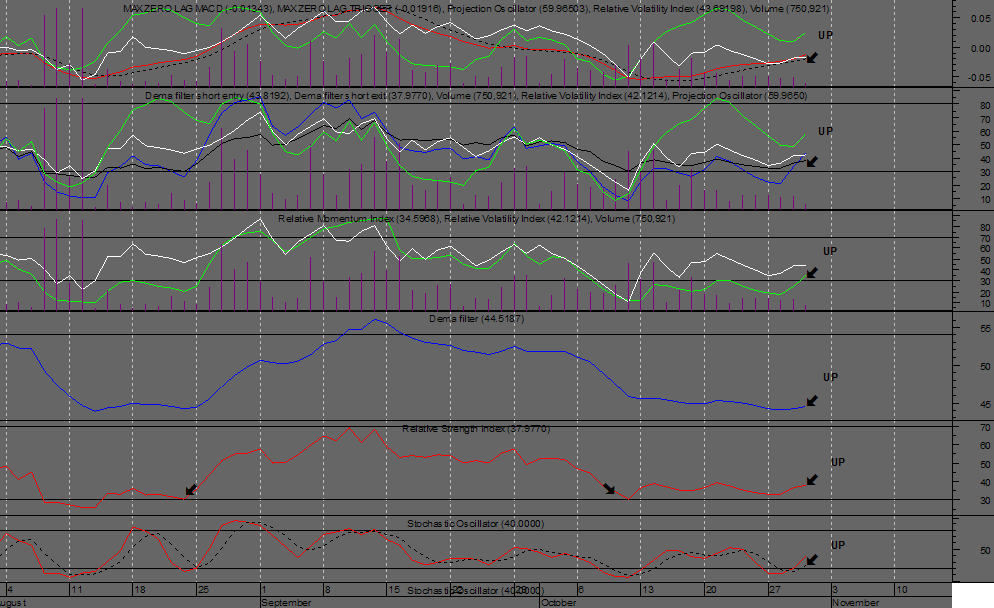
- Forums
- ASX - By Stock
- CNX
- chart
chart, page-25
-
- There are more pages in this discussion • 13 more messages in this thread...
You’re viewing a single post only. To view the entire thread just sign in or Join Now (FREE)
Featured News
Add CNX (ASX) to my watchlist
Currently unlisted public company.
The Watchlist
EQN
EQUINOX RESOURCES LIMITED.
Zac Komur, MD & CEO
Zac Komur
MD & CEO
SPONSORED BY The Market Online
