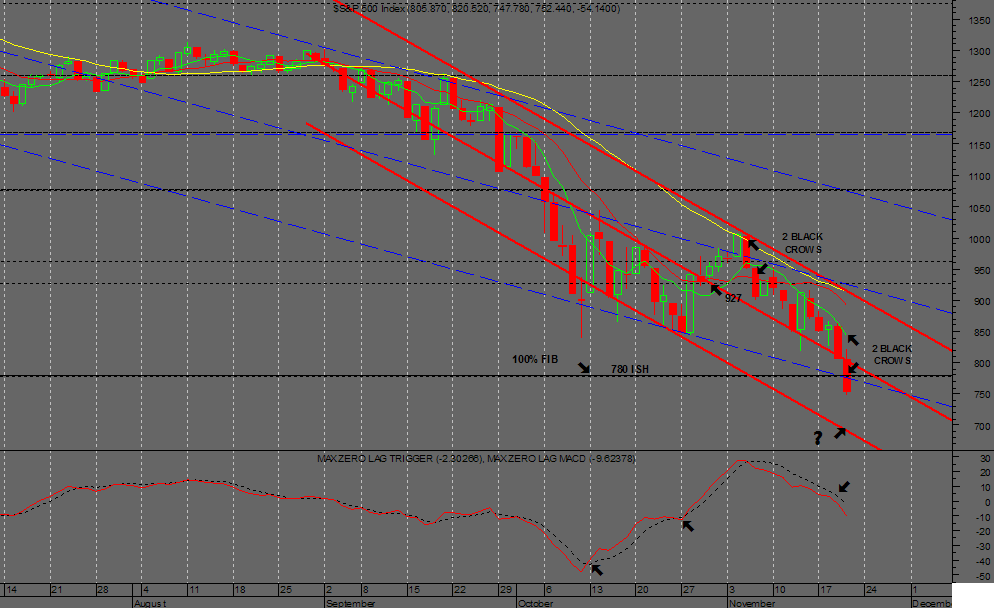
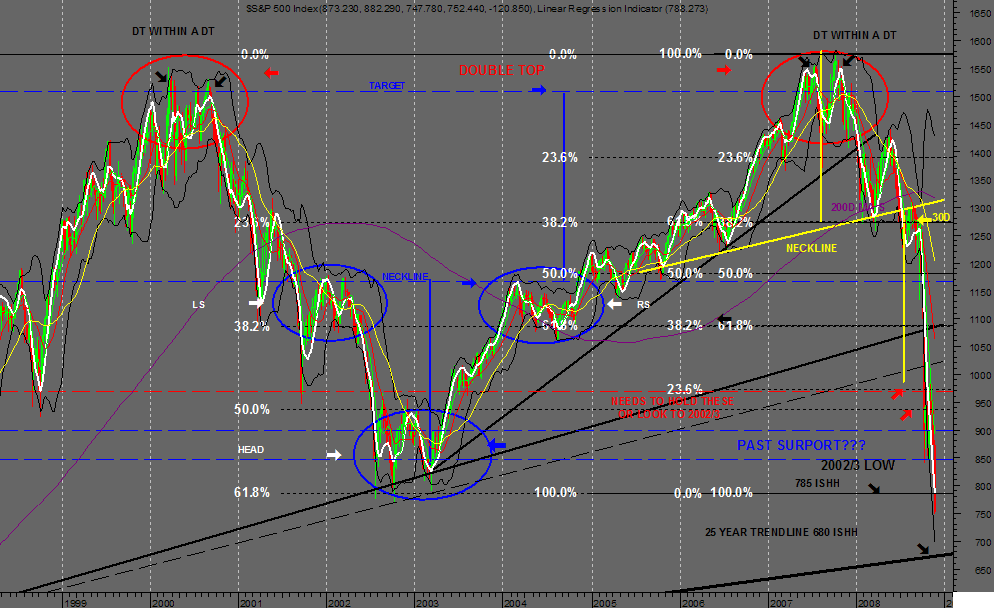
Robbbbb,
I'd love to agree with you there is a slim hope but its not looking good..imo
SP500 Weekly is only 30 odd points below the 100% fib from 2002 and the Double Tops 1st Target so could be a trade through?
There is a 25year trendline at 680 ish.
Daily Chart has brokern the longer SEC in Blue now looks to be using the newer one in Red 2 Black Crows are the candles they can come in 3 Macd is scary.imo plus its Friday..lol.
Cheers Pete
- Forums
- ASX - By Stock
- XJO
- friday trading
XJO
s&p/asx 200
Add to My Watchlist
1.37%
 !
8,757.2
friday trading, page-57
Featured News
Add to My Watchlist
What is My Watchlist?
A personalised tool to help users track selected stocks. Delivering real-time notifications on price updates, announcements, and performance stats on each to help make informed investment decisions.
 (20min delay) (20min delay)
|
|||||
|
Last
8,757.2 |
Change
118.200(1.37%) |
Mkt cap ! n/a | |||
| Open | High | Low |
| 8,639.0 | 8,776.4 | 8,639.0 |
Featured News
| XJO (ASX) Chart |


