Hi meerkat....volt is correct....actually we have discussed this subject ad nauseum but what the heck, it's one of my favourite topics anyway.....
.....there are long secular bull and bear periods that last about (not exactly)17 years....but you are also right to a degree. Within each long bull or bear there are shorter bull/bear/consolidation phases. you can argue exactly where you put the boundry lines but look at the long term charts and this is where I would put them
1929 - 1949 bear (a very loong bear)
1949 - 1966 bull
1966 - 1982 bear
1982 - 2000 bull
2000 - 2017(???) bear
the boundries are a bit blurry I admit. the SPX double topped 14/1/2000 and 11/10/2007....and as you rightly point out that the 87 crash and consolidation of the following years was a bear period.....but I think that was in the context of the longer term bull.....and speaking of that period here is an interesting fact.....after the 1990 bear ended it was upwards all the way for the SPX/DOW for 3382 days to the first peak on 14/1/2000....but it was exactly 17 YEARS TO THE VERY DAY to the second peak on 11/10/2007. If that now happens in reverse to give the chart symmetry we will have 3382 days down from the 2007 high and 17 year from the 2000 high....landing us on 14/1/2017
Could it be that neat ??? LOL
OH, and yes yes...i know the DOW went higher in 07 than 2000 but
a. the SPX didn't really...it double topped
b. it wasn't underlying growth that sent the DOW higher. It was a crazy little thing called subprime. and now we have to pay for that.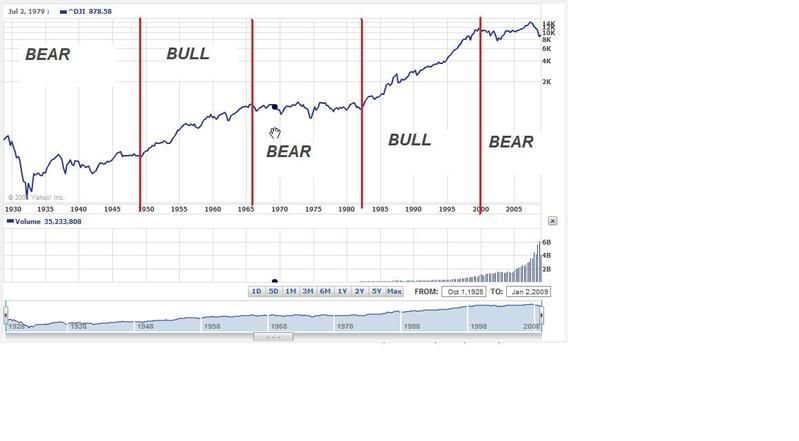


Add to My Watchlist
What is My Watchlist?
 (20min delay) (20min delay)
|
|||||
|
Last
8,570.4 |
Change
-9.700(0.11%) |
Mkt cap ! n/a | |||
| Open | High | Low |
| 8,580.1 | 8,593.6 | 8,558.3 |
| XJO (ASX) Chart |