Well I have made a quick 10 minutes spare to post my pick for the day. It was brought to my attention by a fellow trader on another forum I am on. Cheers Peace.
Flinders Mines (FMS) is showing some very bullish signs on several of the charts I have looked at. These have come about becuase of a few factors, the most important been the positive signs of iron ore recovering, in addition China suggesting it has bottomed out and also the market starting to show signs also of a bottom.
Flinders over the past 6 months has completed a significant amount of drilling. We all know that FMS has a very nice group of tenements which is right next to FMG.
Now to the charts..
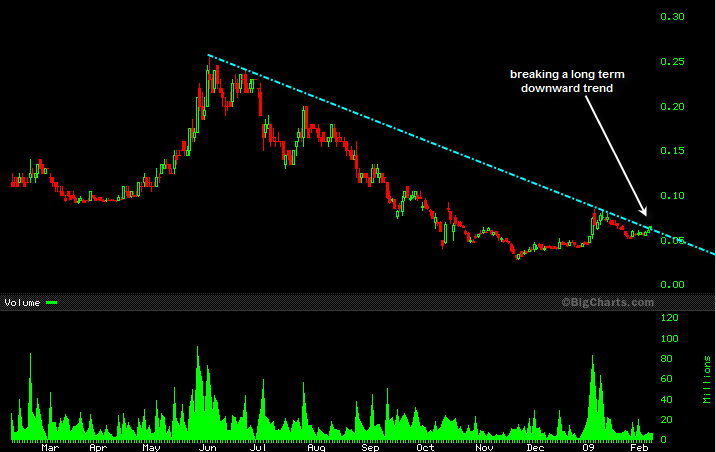
The 1 YEAR chart is showing that the long term downward trend is currently been broken.. this trend has been intact for a long time now, and gives me an indication that the sentiment is changing..
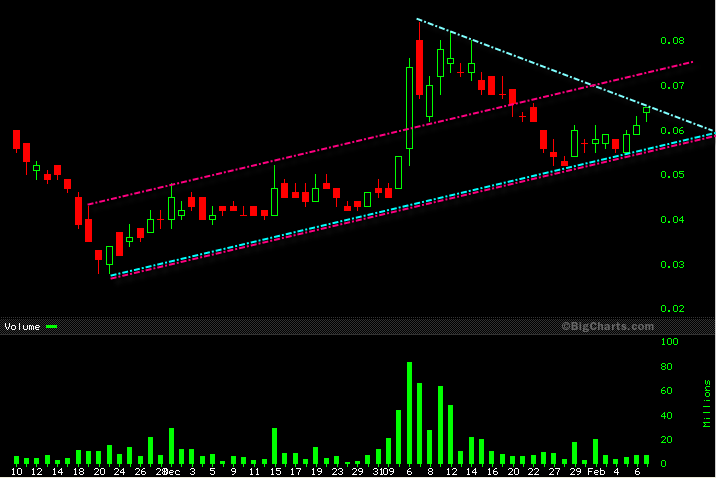
If you look at the shorter term chart (3 MONTHS) you will notice an acending triangle (light blue lines), as well as the recent rising trend channel (purple lines). It looks to me that the upper blue line of the acending triagle is about to be breached with the next lot of resistance @ 7.4c where it meets the top of the trend channel.
Good luck if you buy guys.. I think it could run hard over the coming days if the market sentiment remains positive.