Here is my chart on what I think Will happen. Thanks Robbb for teaching me some stuff like speed angles (pretty sure I did them right???) and learning about the stochastic indicator etc.
So the first graph shows some speed angles ( the lines). It predicts it will hit the lower trend line at around $28.8. Then if we take the up speed angle and that point, it predicts it will then rally (assuming support holds) too $34.5 . If it breaks the light blue trendline, it also has the possibility of hitting $35.8??
Look for the indicators displayed on the 2nd chart. The stochastic daily crossing over under 20 and turning up, as well as the lower trendline being hit at the same time. Then hopefully look for exit when the stochastic indicator crosses over above 80, probably when it hits the upper trendline...
If the stochastic indicator isnt crossing over and it hits the lower trendline, that means there is a chance support will fail... see how before the 21st Novemeber low, the indicator was still dropping, and the lines had not diverged at that point.
DYOR im still new to all this, and have barley but my charts to use in real trades just yet =]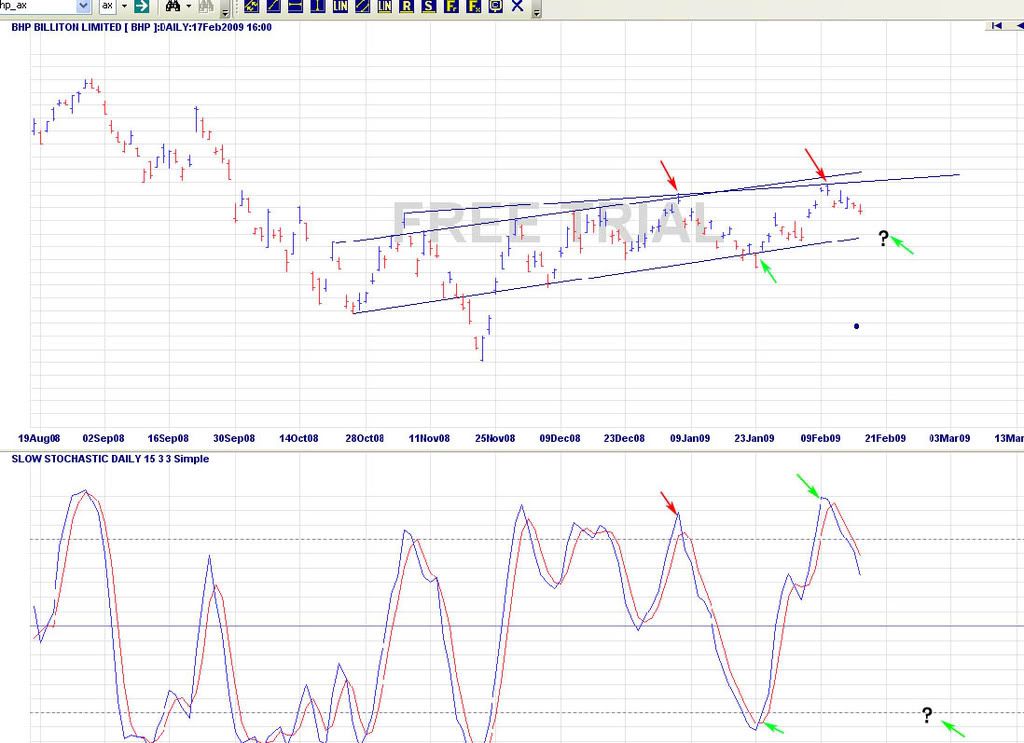
how much lower, page-8


Add BHP (ASX) to my watchlist
 (20min delay) (20min delay)
|
|||||
|
Last
$43.30 |
Change
0.620(1.45%) |
Mkt cap ! $219.5B | |||
| Open | High | Low | Value | Volume |
| $42.75 | $43.39 | $42.74 | $244.0M | 5.654M |
Buyers (Bids)
| No. | Vol. | Price($) |
|---|---|---|
| 2 | 21962 | $43.29 |
Sellers (Offers)
| Price($) | Vol. | No. |
|---|---|---|
| $43.30 | 4233 | 1 |
View Market Depth
| Last trade - 16.10pm 01/07/2024 (20 minute delay) ? |
| BHP (ASX) Chart |