speaking of armstrong's turn date..... PPs usd chart today got me thinking again.....
we was all wondering the other day what earth shattering event could happen around armstrong's turn date to send the world economy into (further)chaos....we talked about a possible currency collapse.......
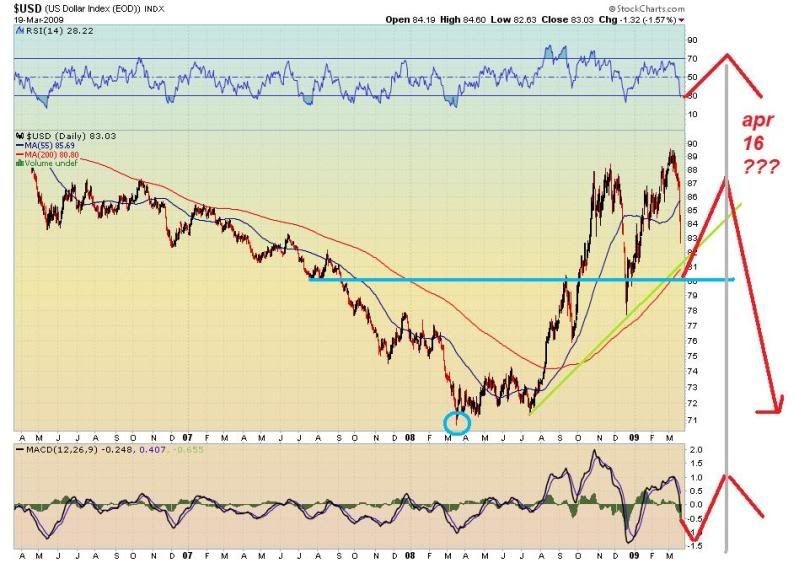
looking at the USD chart it bottomed when the market bottomed on 17/3/2008. but unlike the market it has been on the rise ever since. armstrong's cycle is an economic confidence model so if the world has had no faith in the markets at least since the last bottom of armstrong's cycle it's confidence in the USD as a "safe" haven has been growing.
as peter's chart demonstrated today the USD is heading down fast to the 200 dma. around about that point is an upsloping support trendline and a bit of horizontal support as well. If we see a bounce of the USD in the next day or so off those converging lines then we may have enough time left till april 16 for one more lower high....which a polite way of saying a right shoulder.
My lines aren't drawn to scale very well but you get the picture :
friday, page-19


Add XJO (ASX) to my watchlist
 (20min delay) (20min delay)
|
|||||
|
Last
8,221.5 |
Change
10.200(0.12%) |
Mkt cap ! n/a | |||
| Open | High | Low |
| 8,211.3 | 8,226.5 | 8,199.7 |
| XJO (ASX) Chart |