Morning all and i hope this finds you all healhtier and wealthier than last week, feel free to pop a request up, i will be hanging around till midday and then back in late this afternoon. I looked back over some of our charts from last weekend and in general we did OK , i think RIO was the stand out shocker and LOD and BOW might have beeb the better ones ???
Another fantastic green week with the retrace starting friday it seems. I must admit i have been hoping for the retrace which is healthy for a possible 60 day rally.
Many of our majors are in overbought positions and many hit short term targets through the week.
PS: dont forget your stops
Where to from here ???
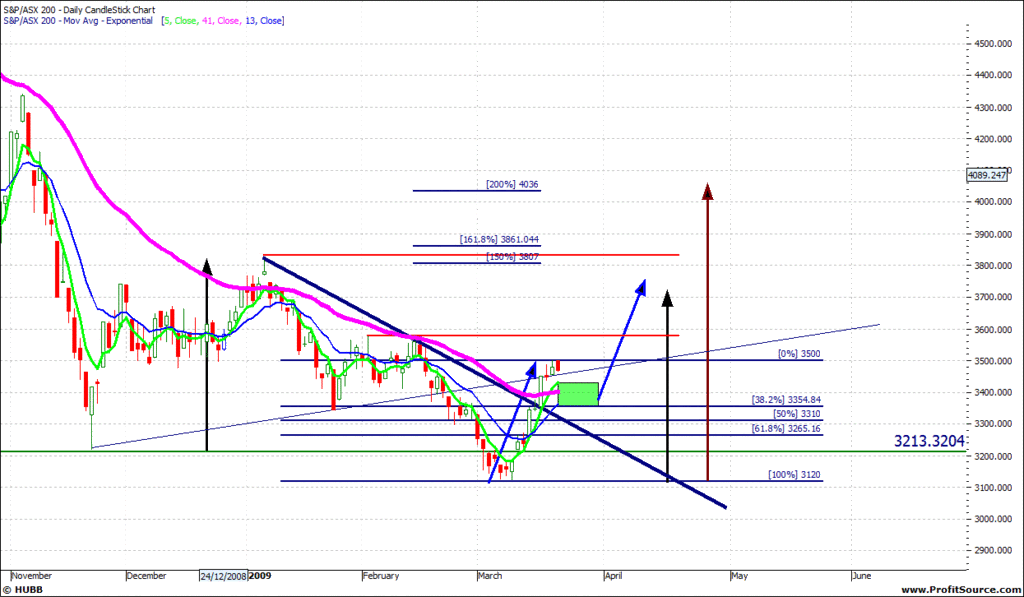
- Im looking for a retrace into the 38.2% or 50% area, and or supporting on the 41EMA (pink line) prior to an attempt at another leg up.
- Black arrow is November Rally
- Brown arrow is March 08 Rally
- March rally was 18% which is the same as the November Rally in terms of percentage gain
- initally i thought we would stop at the pink line, so was excited to see us push through it by a good bit as now we have a chance of supporting on it with the retrace lending strenght to a continued rally argument.
Weekly still looks primed for a continued rally and sure it might pull back a bit here but lets be patient and smart :)))
DJIA
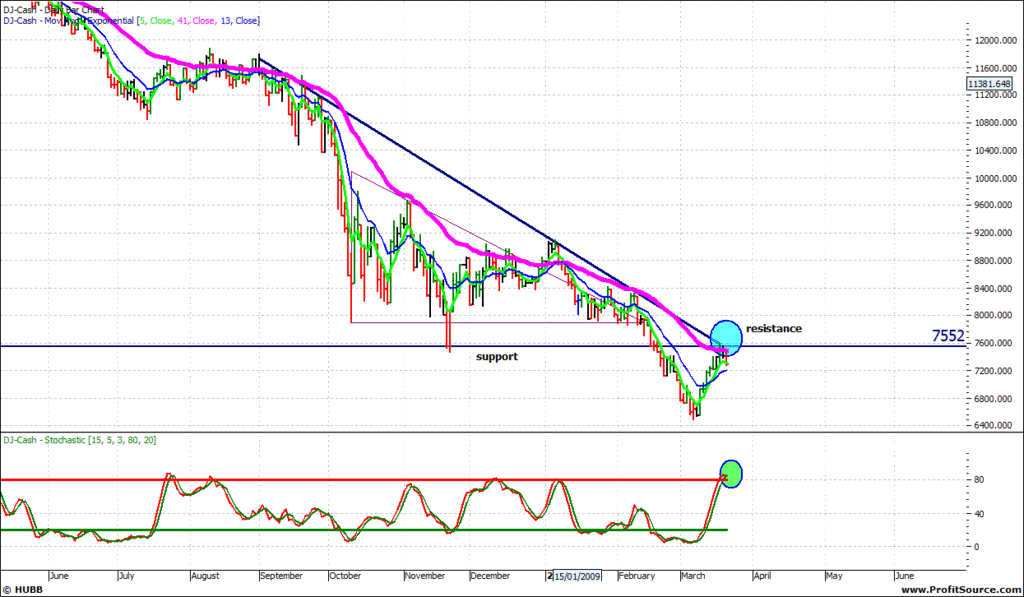
Knowing targets and watching ranges repeat and indicators suggesting whats going to happen still amazes me. Clearly it was evident where it might struggle.
I had some targets over the week on the djia and each one got hit within 40 points, which just highlights how predictable charts can be at times.
Looking ahead needs to support on the 13 MA in coming days or possible retrace to as low as 7000. As we all know the yankee doodles do what they wish so i just focus on my risk/reward ratio's
OIL
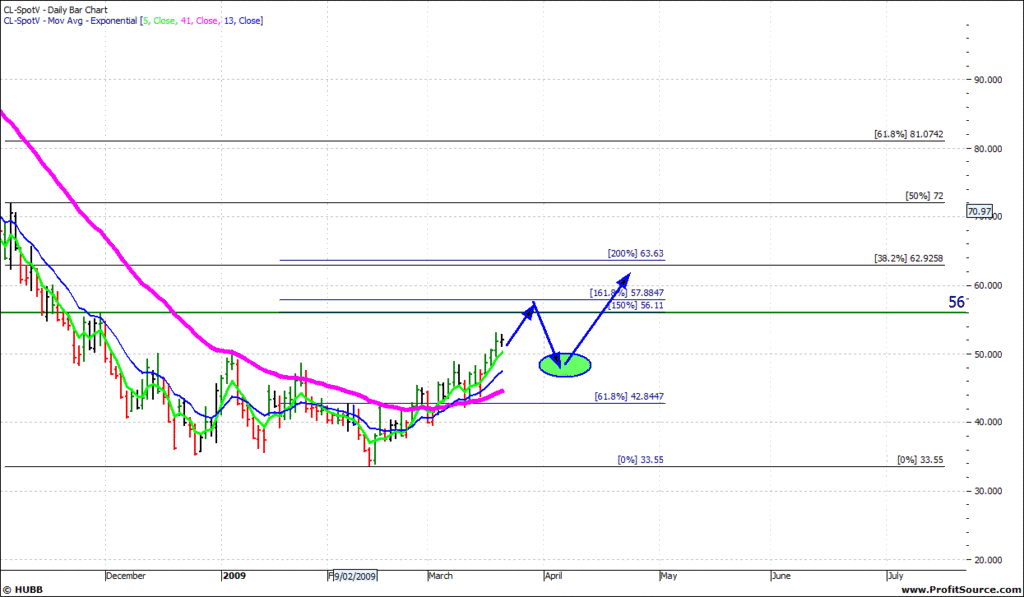
Let the position ride, which is something i didnt do when i shorted oil at the highs, as alot know i have been long oil for awhile with an average in at 38. I have no reason to sell as you can see by the MA's
56 is a major resistance and support line for years so that should be an obvious target in time.
I then look at the fall and measured from the 100 to the 33 lows and 38.2% level is 63 ish.
If the chart follows my little arrows then i will probably add a 4th position
GOLD
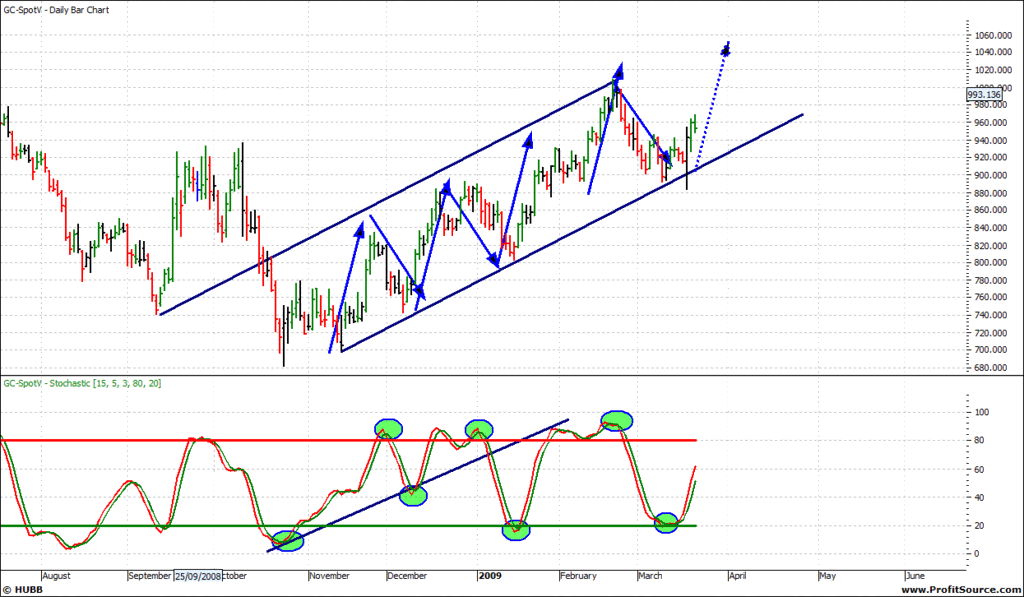
I have concenrs on the weekly gold chart, but i have learnt to play with the ranges thta make the money and currently gold is churning out the trades up and down
Since the november lows its been
4 longs @ 15%
3 shorts @ 10%
Does it can any easy than that
What amuses me though is the continued banter and constant posting of articles FOR and AGAINST gold while the chart just go up and down, up and down. :))))))
AUSSIE DOLLAR
Currently looks a tad overbought and im thinking aloud with a few arrows there, the weekly had a clear stand out target of 73ish with a max of 77ish ????
I dont trade currency so i dont know the tricks of the trade there.
My brother in law asked for some thoughts going forward so thats just one of the charts i did for him :))))
- Forums
- ASX - General
- sunday charting
sunday charting
Featured News
Featured News
The Watchlist
ACW
ACTINOGEN MEDICAL LIMITED
Dr. Steven Gourlay, CEO
Dr. Steven Gourlay
CEO
Previous Video
Next Video
SPONSORED BY The Market Online


