Hi Stun this is also a 60 min chart.
the support at 336 was a 62% fib support of the last small wave within the triangle so that was good to see a close above that ,the price may bounce around within the triangle/wedge range still, and usually the 1st trendline to receive 3 hits is the one thats going to break, in this case the top has has had 3 hits.
with the 342 im watching to see if it bounces of that a few times(support)on the 60 min.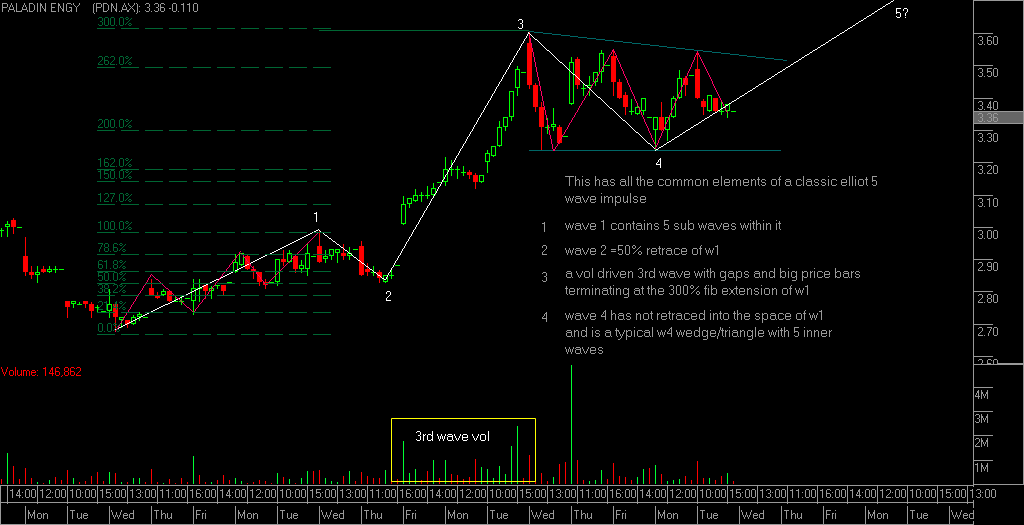
chart, page-21


Add PDN (ASX) to my watchlist
 (20min delay) (20min delay)
|
|||||
|
Last
$10.41 |
Change
0.270(2.66%) |
Mkt cap ! $3.115B | |||
| Open | High | Low | Value | Volume |
| $10.43 | $10.49 | $10.31 | $8.731M | 832.2K |
Buyers (Bids)
| No. | Vol. | Price($) |
|---|---|---|
| 10 | 2190 | $10.40 |
Sellers (Offers)
| Price($) | Vol. | No. |
|---|---|---|
| $10.41 | 5734 | 27 |
View Market Depth
| Last trade - 14.27pm 16/08/2024 (20 minute delay) ? |
| PDN (ASX) Chart |