Here is my RIO chart. Doing some for my grandfather on ones he owns. Thought it would be useful for anyone learning charts, or people who own the shares :)
Daily-
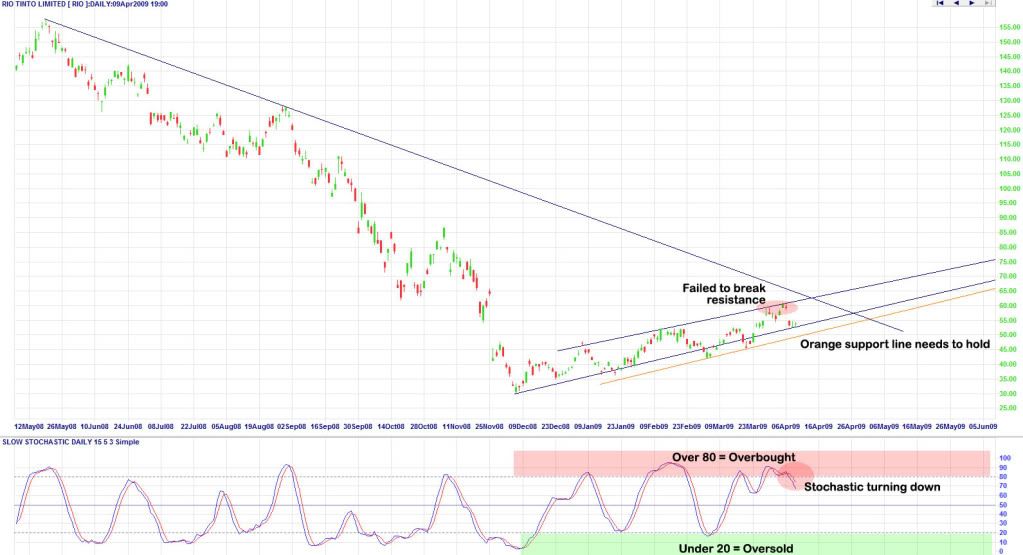
It has failed to break the resistance a few times lately. It gapped back down on tuesday. The lower orange support line needs to hold. However, the stochastic has turned down, so it looks like it is likely it will at least fall back down to the orange line. This could happen at around $50.
Weekly-
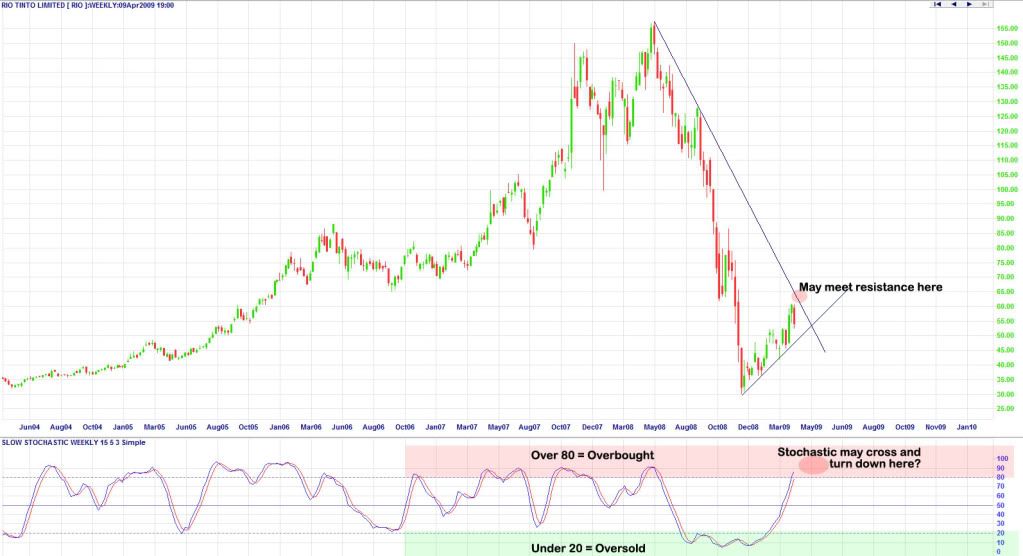
The weekly is currently in a nice upwards trend. However the stochastic is approaching overbought, and may start to turn down in a week or two. It may hit the upper resistance though first at around 61.6
Monthly-
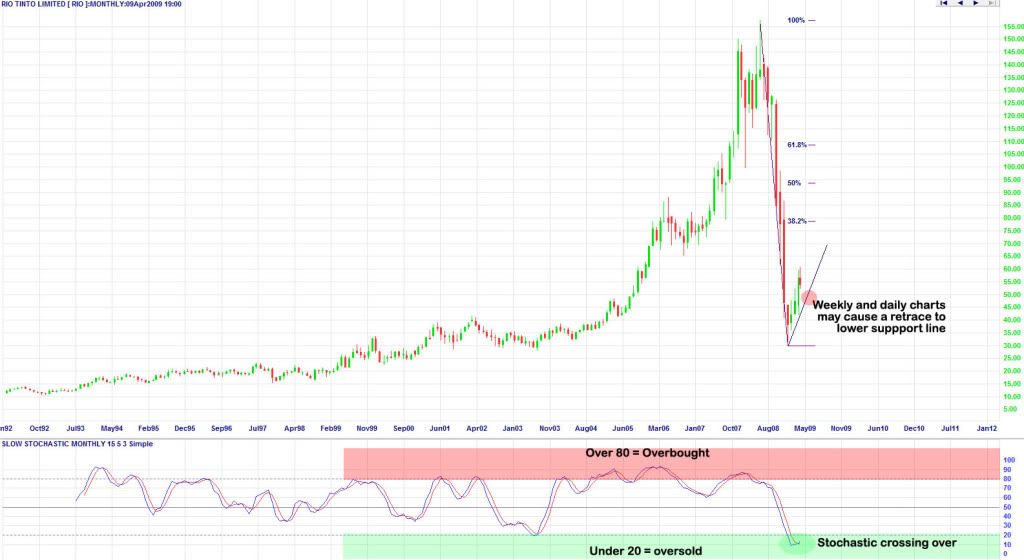
The monthly currently is in an uptrend. The stochastic has started to cross over from the most oversold the share has been (at least in my data). This is a great sign for the long term. The daily and weekly charts may see the price return back to the lower trendline at around 48 dollars.
Overall-
Daily and weekly looking for a pullback in the short term, possibly too $48. But the monthly is showing very oversold, and the long term prospects for RIO are looking good. If you arnt in RIO at the moment, it could be a good buy at around $48 if the daily stochastic is turning back up.
- Forums
- ASX - General
- weekend charting


