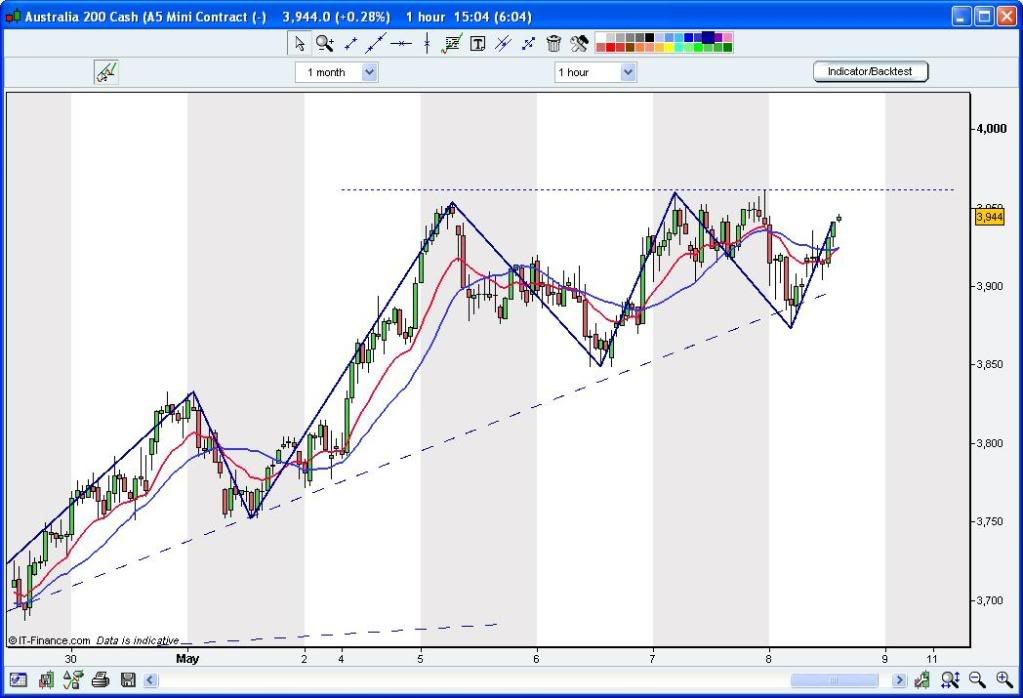
Well, i have just become the worlds biggest fan of plain old, boring, Dow theory and convinced my self again of just watching the price action and forget the rest... armstrong and moons etc are interesting, but for me, I need to see proof. All wavy lines are indicative, price is the confirmation.
Having said that, anything above 3960 is a new high (ascendng triangle forming) and a break below 3850 may (may) signal a trend change - with confirmation of a lower swing low. Till otherwise is confirmed, the trend is intact.
If I had of followed this all year, I would be way up :)
- Forums
- ASX - By Stock
- XJO
- friday finish
friday finish, page-70
Featured News
Add XJO (ASX) to my watchlist
 (20min delay) (20min delay)
|
|||||
|
Last
8,118.8 |
Change
-41.200(0.50%) |
Mkt cap ! n/a | |||
| Open | High | Low |
| 8,160.0 | 8,160.0 | 8,063.2 |
Featured News
| XJO (ASX) Chart |


