hi guys, let us nver forget that Armstrongs model is for the underlying economy. his last peak was in feb 07 and was bang on target with the busting of the US housing bubble.....and yet the market continued to climb a wall of worry until october. So what could it be this time ??? We suggested here on XJO a few months ago that the next crisis may be currency orientated. After all the US has been printing money like there is no tomorrow.
Refer to the chart below. the USD triple topped. the 3rd top was on the 20th april.....the first trading day after armstrongs turn. It is now below the 200 dma for the first time since august 08. the 50 dma has turned down sharply. If it continues it is only a matter of time before it crosses below the 200. It may be that after a time lag the stock market may think "oh dear !!". and we may experience that big final leg down. also note one other possible clue is that the USD bottomed last march and that is also where the last armstrong bottom was.
.....but in the meantime i am enjoying what could be the last hurrah top.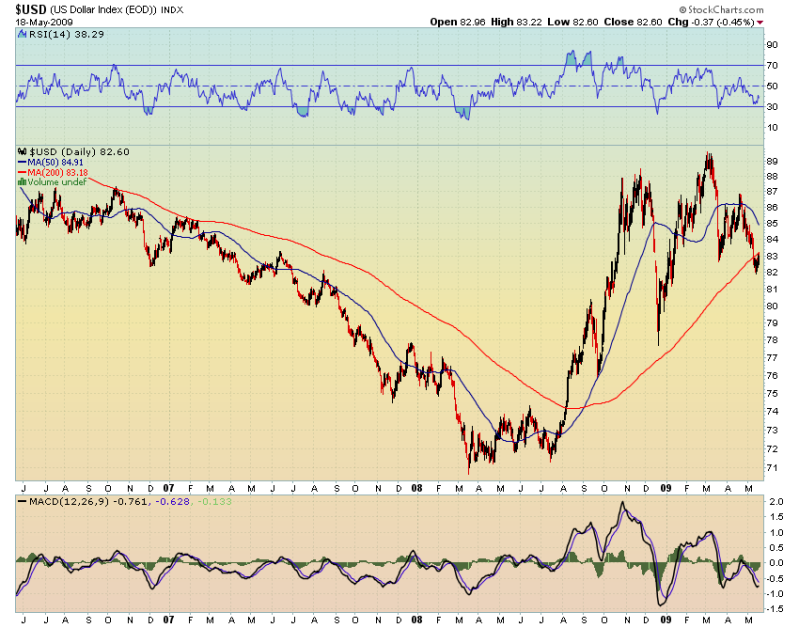
armstrong's latest read, page-8


Add XJO (ASX) to my watchlist
 (20min delay) (20min delay)
|
|||||
|
Last
7,767.5 |
Change
7.900(0.10%) |
Mkt cap ! n/a | |||
| Open | High | Low |
| 7,759.6 | 7,819.0 | 7,754.9 |
| XJO (ASX) Chart |