Hello all,
Yesterday I mentioned that I've bought into AXY, based on technicals, but didn't go into much details. I'd like to think that I make claims with some evidence so I'll present it in this post. Be gentle, whilst not new to shares, I'm still quite new to trading, usually my "trades" turn into hold and wait type things. BTW, I got a small parcel at 4c, I think I was the first to buy in at 4c yesterday.
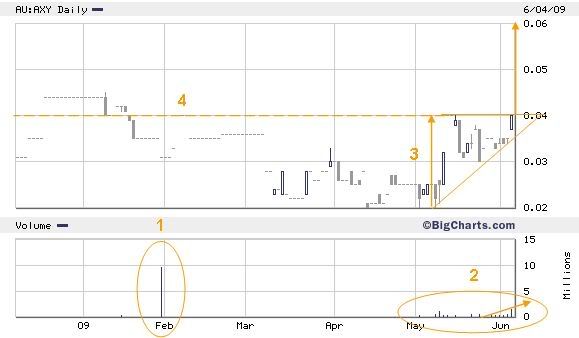
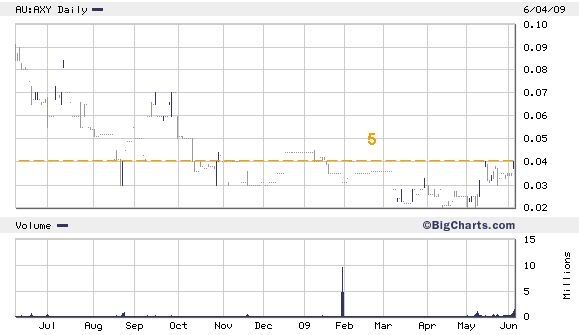
Here is a six month daily chart & a one year daily chart, with notes provided below:
1) That spike on 30th Jan 2009, was from the actions of Horizon Drive buying 9.6m onmarket after the quarterly results were released. Spikes like this before uptrends occur are usually a positive sign that someone has confidence in the company over a medium to longer term.
2) Volume in May is starting to increase, and the trend in Early June is increased volume - Volume is what matters in driving price up.
3) An ascending triangle being formed on the back of the increasing volume. The increase in price by two cents, in theory sets a target of 6c if and when a breakout will occur.
4) Resistance seems to pivot about the 4c price over the past 6 months
5) Resistance at 4c also shows up when looking over the past 12 months.
If the price jumps over 4c with increased volume, that would be a VERY bullish signal in my opinion.
Add to My Watchlist
What is My Watchlist?


