Here is SBM:
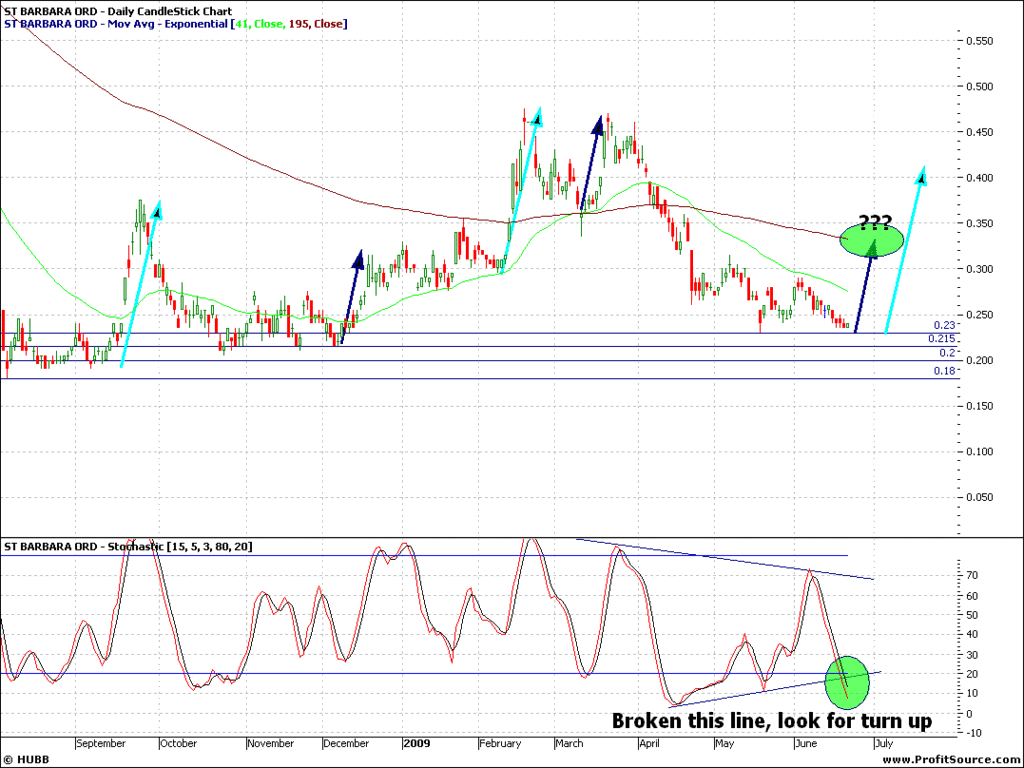
Daily:
You can see a couple of speed angles that might play out. Would definantly be looking for the dark blue one first, which would bring it to the 195EMA. However, note the stochastic is getting nicely oversold. You can see some support lines at 23, 21.5 , 20 and 18. Im willing to bet it wont go lower then 18 unless a really bad announcement comes out.
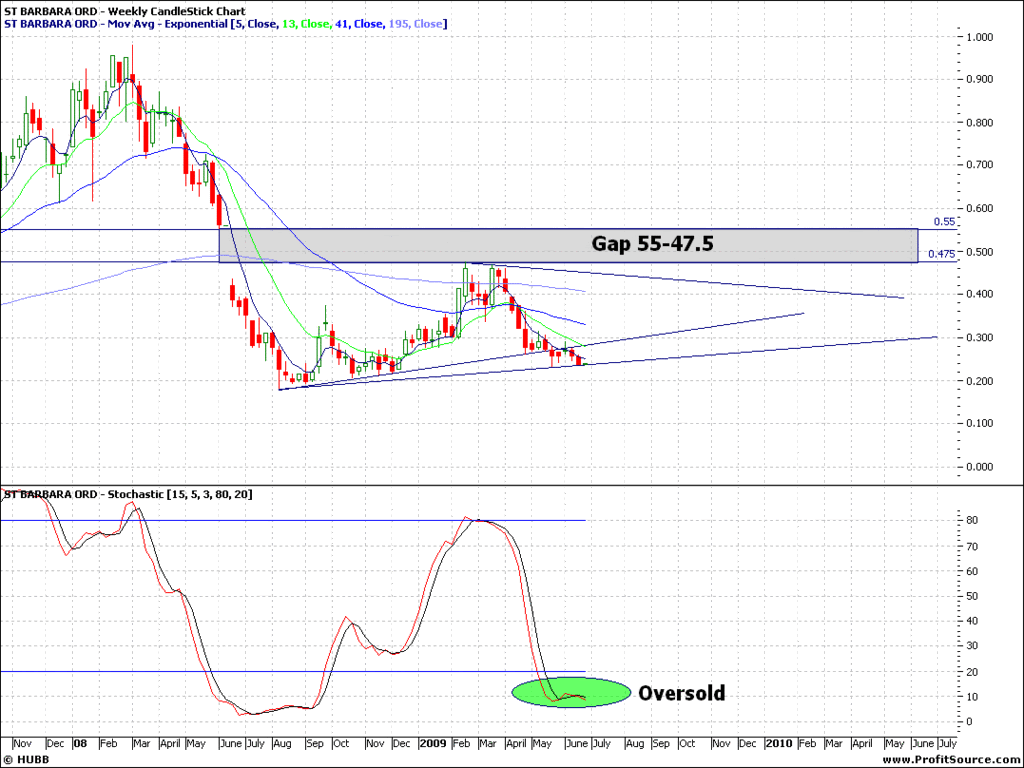
Weekly:
This is what really caught my attention. While there are some shares ive seen with oversold daily stochastics, I havnt actually found shares with oversold daily AND weekly stochastics. This is what made me buy some today at 23.5. You can also see a gap at 55-47.5 which could be filled sometime in the future.
- Forums
- ASX - By Stock
- SBM
- chart
chart
-
-
- There are more pages in this discussion • 27 more messages in this thread...
You’re viewing a single post only. To view the entire thread just sign in or Join Now (FREE)
Featured News
Add SBM (ASX) to my watchlist
 (20min delay) (20min delay)
|
|||||
|
Last
33.0¢ |
Change
0.005(1.54%) |
Mkt cap ! $270.0M | |||
| Open | High | Low | Value | Volume |
| 34.0¢ | 35.0¢ | 33.0¢ | $3.529M | 10.42M |
Buyers (Bids)
| No. | Vol. | Price($) |
|---|---|---|
| 16 | 464135 | 33.0¢ |
Sellers (Offers)
| Price($) | Vol. | No. |
|---|---|---|
| 33.5¢ | 1700 | 1 |
View Market Depth
| No. | Vol. | Price($) |
|---|---|---|
| 15 | 364135 | 0.330 |
| 17 | 640823 | 0.325 |
| 26 | 1090139 | 0.320 |
| 13 | 474322 | 0.315 |
| 15 | 324114 | 0.310 |
| Price($) | Vol. | No. |
|---|---|---|
| 0.335 | 1700 | 1 |
| 0.340 | 674972 | 5 |
| 0.345 | 174611 | 4 |
| 0.350 | 322945 | 6 |
| 0.355 | 346578 | 7 |
| Last trade - 16.10pm 08/11/2024 (20 minute delay) ? |
Featured News
| SBM (ASX) Chart |
The Watchlist
EQN
EQUINOX RESOURCES LIMITED.
Zac Komur, MD & CEO
Zac Komur
MD & CEO
SPONSORED BY The Market Online


