
this road map works as such..
this is a 24 hr chart..
LIS defines the trend for the day..above the red line (line in sand ) you are looking for longs, below you are looking for shorts..each no is a strong support/resistance..
hope you find this chart of some help trading the spi..
have a good day, and take care
ac
above text is just a re post on yesterday's chart, as i posted it in the wrong place :-)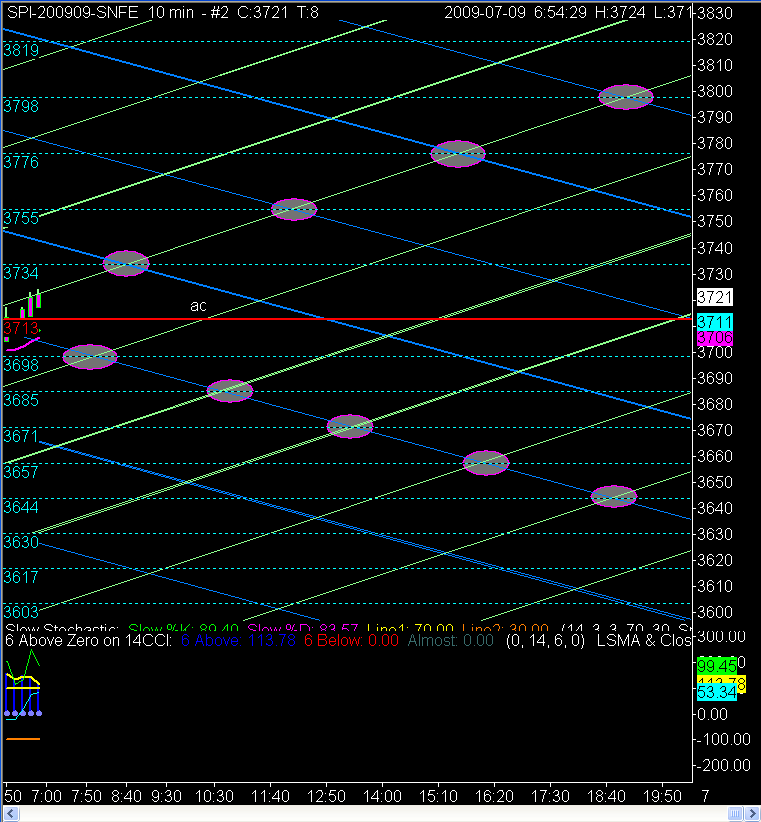
spi road map


Add XJO (ASX) to my watchlist
 (20min delay) (20min delay)
|
|||||
|
Last
7,971.6 |
Change
-64.900(0.81%) |
Mkt cap ! n/a | |||
| Open | High | Low |
| 8,036.5 | 8,036.5 | 7,923.6 |
| XJO (ASX) Chart |