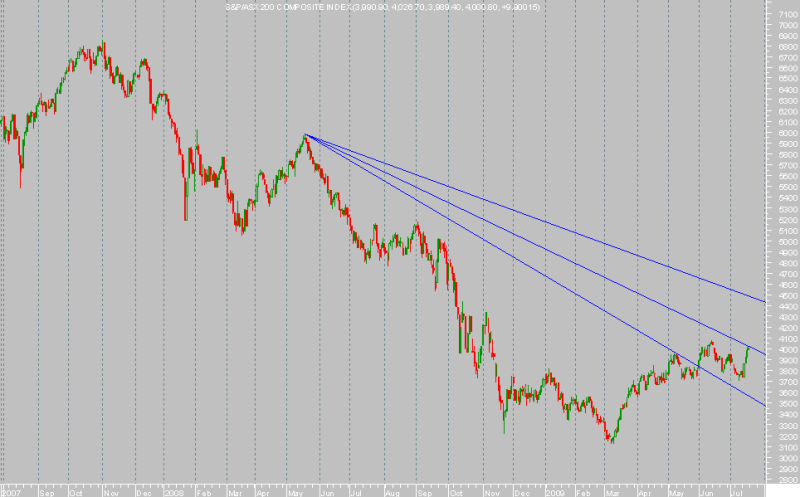
I don't know about anyone else but I am finding more and more that the May 08 top seem more connected in a fibonacci sense to the market since the low than is the Oct 07 absolute top.
Have a look at this fib fan that is referenced between the May 08 top and the march 09 low. First touch of the lowest fan line was the recent may 09 top. Today we touched the middle fan line. That suggests a high possibility of a pullback (not suggesting armageddon here). We could break straight through but if we are gonna pull back this is where it should happen IMO.
In the second chart I have zoomed in on the 2 recent touches mentioned.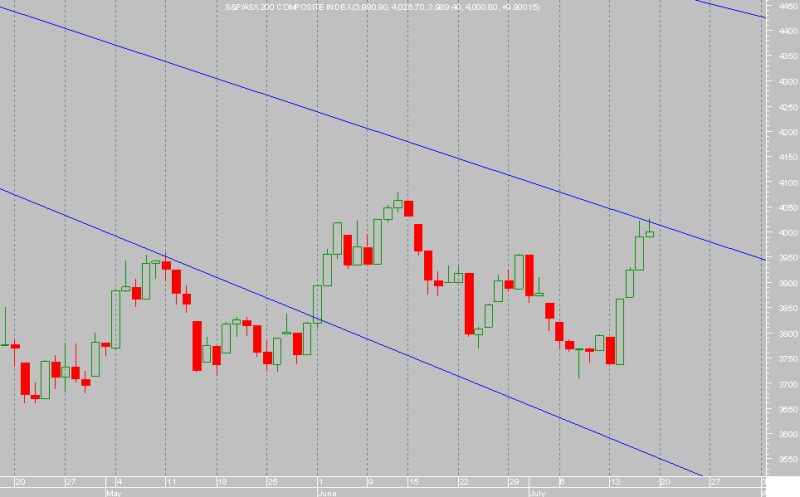


Add to My Watchlist
What is My Watchlist?
 (20min delay) (20min delay)
|
|||||
|
Last
8,757.2 |
Change
118.200(1.37%) |
Mkt cap ! n/a | |||
| Open | High | Low |
| 8,639.0 | 8,776.4 | 8,639.0 |
| XJO (ASX) Chart |