Hi ifandwhen
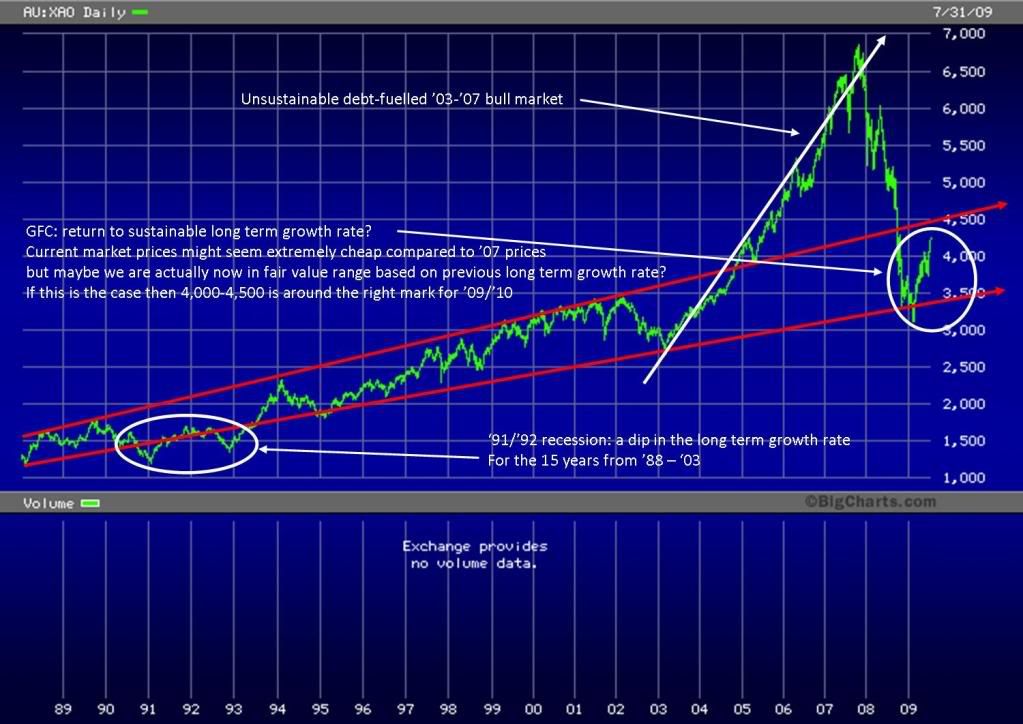
Great post - I was thinking exactly the same thing. So I dug up an XAO chart (couldnt get a 10 year XJO chart) to illustrate the point:
Call it the reality line or range, but if you consider the long term growth rate of the market established in the 15 years before the debt-fuelled bull market as shown, then the extension of that line/range to me shows the market has returned to a long term "fair value range", and based on that long term trend fair value is currently around 4,000 and maybe as high as 4,500 for another year or so. Anything more than that in my view would have to be proven sustainable based on a fundamental change in the market such as a change in household savings/investment rates.
Caylus, Noomx et al, great threadof discussion over the weekend - one of the best for some time (I like my TA but its great to see a rational FA debate once in a while).
Cheers, Sharks.
- Forums
- ASX - By Stock
- XJO
- thoughts.
thoughts., page-55
-
- There are more pages in this discussion • 2 more messages in this thread...
You’re viewing a single post only. To view the entire thread just sign in or Join Now (FREE)
Featured News
Add XJO (ASX) to my watchlist
 (20min delay) (20min delay)
|
|||||
|
Last
8,295.1 |
Change
68.800(0.84%) |
Mkt cap ! n/a | |||
| Open | High | Low |
| 8,226.3 | 8,319.4 | 8,226.3 |
Featured News
| XJO (ASX) Chart |
The Watchlist
EQN
EQUINOX RESOURCES LIMITED.
Zac Komur, MD & CEO
Zac Komur
MD & CEO
SPONSORED BY The Market Online


