Chris and Mongo
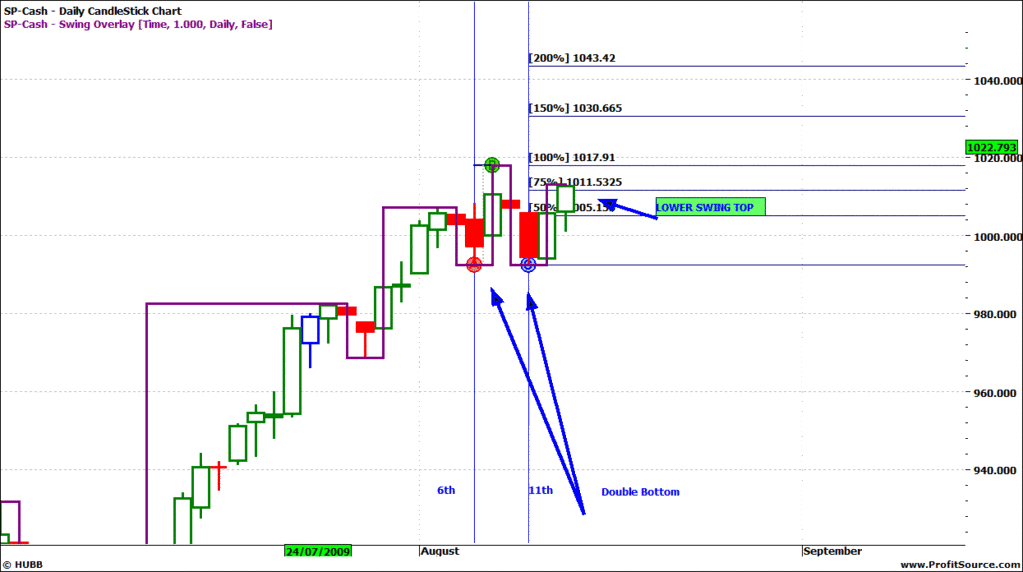
I see the double bottom too and so close to what might be a top, its sometimes a good spot to trick the weak ends into buying it. It should have failed at the 50% but momentum got it to the 75%. So what it has now done has put a lower swing top on the chart to confuse both arguments :)))
So for the shortes P1 was last night and P2 would be break of that double bottom,For the longs they have P1 and P2 break of DB high.
The indicators right about now would be in favour of the bear which is good for the bulls as consolidation is a major requirement IMO
Regards
Rob
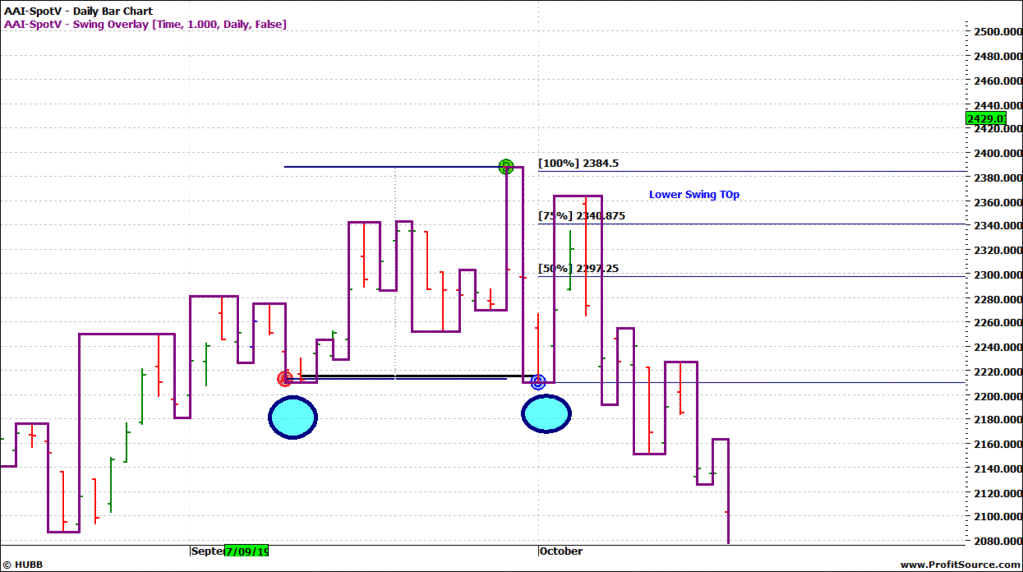
We did the same double bottom trick just before the June high( it got to 150% though), and in fact the SPI did the same thing just prior to the 1987 crash ( failed at 75% and 22 days apart).
1987 chart
Earlier this week i showed current chart with the nice time and price set up, this is the one leading into the 1987 top.
Add to My Watchlist
What is My Watchlist?


