Hmmmm intresting storm over a little chart..
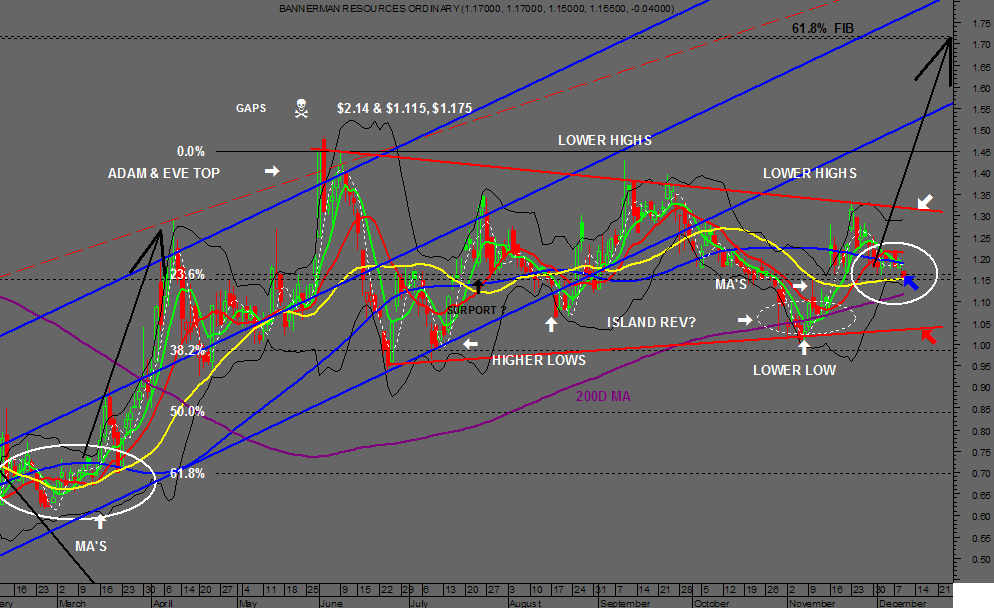
Anyway just a updated chart now it has a brand new gap @ $1.175
I've put in a better example of the MA's crossing although this could take a week and a bit by the looks and show a range that could repeat (Big Black Arrows) Thats back to the 61.8% Fib..
This is also hinting at filling the lower Gap now $1.115 if it dose I'm it will be just a quick down and up 200d ma should support atm its got to get past the 30dma (Yellow) and the fibs You can also see each time its traded below the 30d ma it hasn't ventured to far from it so less risk of buying under it and even less with higher gaps..imo
Sideways could also go on for quite some more time but keep a eye on the ma's..
The charts pretty simple to understand bearing all that in mind its trading range is between the 2 red lines if it breaks either its going down or up in a hurry even the Cave Dwellers and Flat Earth crew should be able to see that..
Some good TA recommendations on the thread I'll chuck in Guppy, Bedford Brown & Nielson on Candle Sticks..pluss what Robbbbbbb say's..
Cheers Pete.
PPS Just spent 2 hours wrighting the rest of this and HC can't find it after it failed due to you...lol mods look at this please.....A Hoodo from the Cave Dwellers...imo
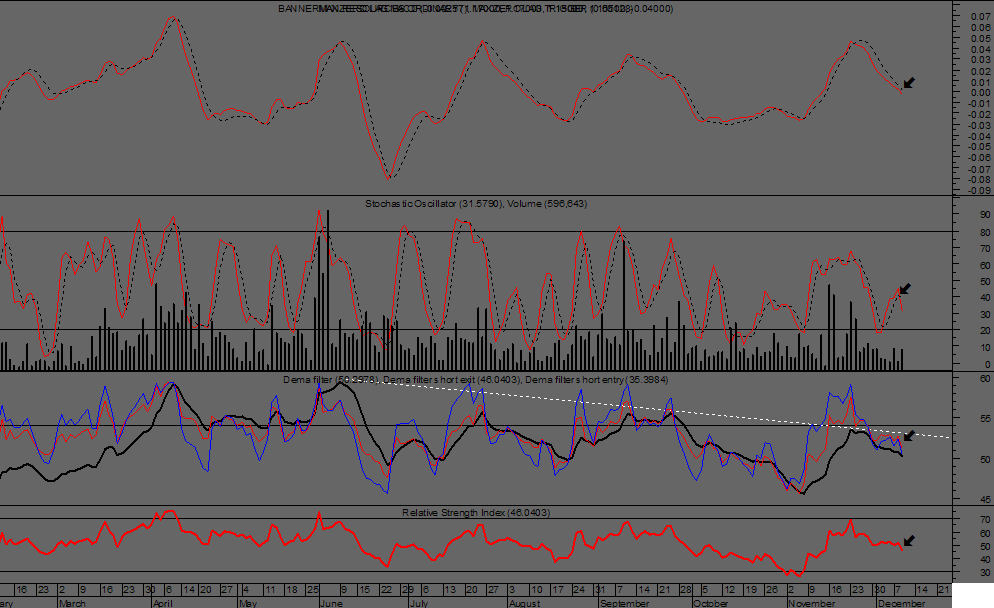
Daily Chart...

Weekly Chart.
Looks to have a small Descending Triangle but I'm not convinced just yet ...but that is looking why the Gap maybe filled on the Daily...note the Trendline (White) and the Red line..
But at worest may bounce off the lower support Red Line
- Forums
- ASX - By Stock
- BMN
- here ya go fm
here ya go fm, page-24
-
- There are more pages in this discussion • 14 more messages in this thread...
You’re viewing a single post only. To view the entire thread just sign in or Join Now (FREE)
Featured News
Add BMN (ASX) to my watchlist
 (20min delay) (20min delay)
|
|||||
|
Last
$2.60 |
Change
-0.390(13.0%) |
Mkt cap ! $457.0M | |||
| Open | High | Low | Value | Volume |
| $2.76 | $2.79 | $2.55 | $3.706M | 1.410M |
Buyers (Bids)
| No. | Vol. | Price($) |
|---|---|---|
| 1 | 6567 | $2.59 |
Sellers (Offers)
| Price($) | Vol. | No. |
|---|---|---|
| $2.61 | 7988 | 2 |
View Market Depth
| No. | Vol. | Price($) |
|---|---|---|
| 1 | 7751 | 2.580 |
| 3 | 75971 | 2.560 |
| 2 | 2392 | 2.550 |
| 1 | 395 | 2.530 |
| 1 | 200 | 2.520 |
| Price($) | Vol. | No. |
|---|---|---|
| 2.650 | 8834 | 2 |
| 2.680 | 6000 | 2 |
| 2.750 | 1000 | 1 |
| 2.780 | 4000 | 1 |
| 2.850 | 30000 | 2 |
| Last trade - 16.10pm 02/08/2024 (20 minute delay) ? |
Featured News
GML
Gateway Mining sells WA Eastern Montague gold project to Brightstar for $14M – half of that in shares
TG1
TechGen Metals kicks off airborne geophys survey at Sally Downs copper play – a first for the permit
| BMN (ASX) Chart |


