??? How so pattyp ??? Please explain ...
Volt - we seem to have entered a similar Aussie200 cash period as ended on 27Nov09. Lasted 8 days - this one maybe 3 days remaining, then down??? (Using IGM)
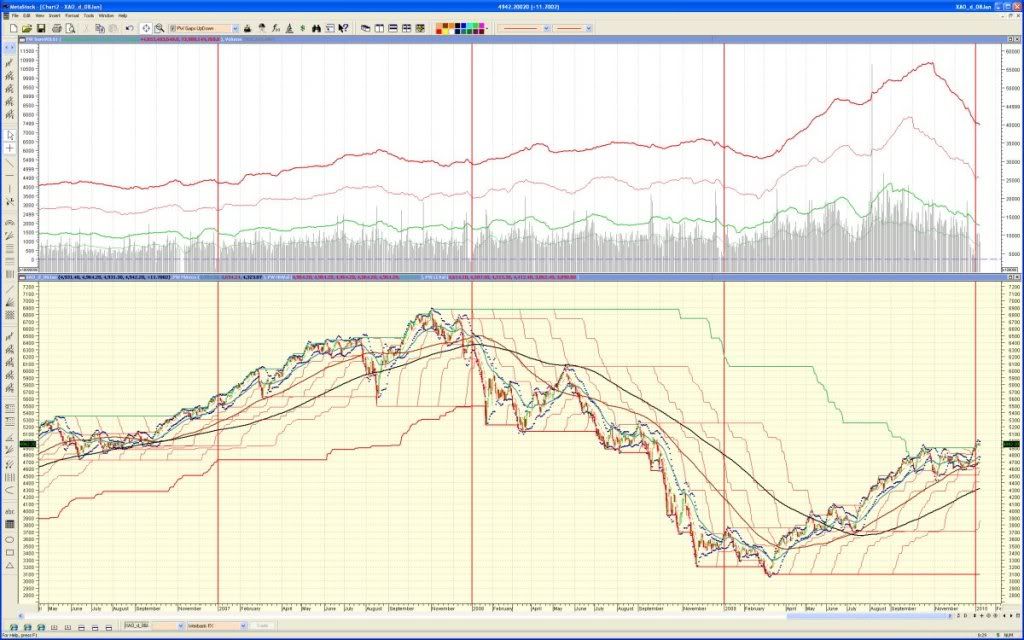
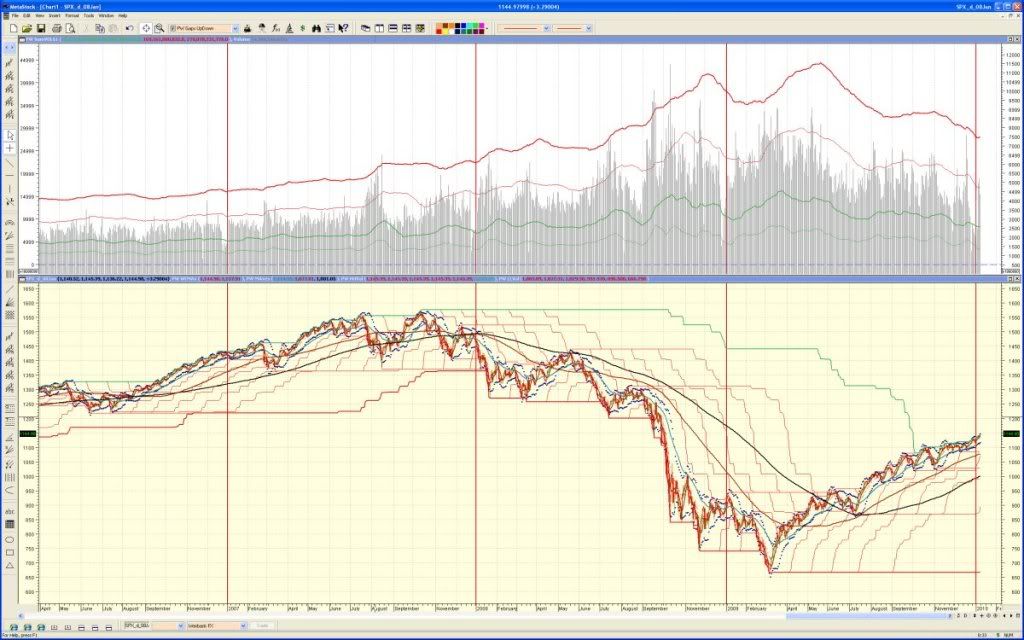
I did these volume charts (below) for XAO and SPX; our increase is marginal/roughly on a par compared to the volume through the SPX. Mind you, the data is from finance.yahoo ....
I am forming an opinion that higher volumes cause price turnovers/corrections quicker.
First the accumulation to a peak, then a selloff based on the time & volume of the build up. More volume during the selloff might cause the crash to happen more quickly .... or not.
A bit like getting it over and done with ...
rgds,
pw
(upper portion is volume trends, thick red line is 3 monthly cummulative)
XAO showing volume -
SPX showing volume -
SUMMARY -
Volumes as measured at end of year (for simplicity)
XAO
2006/07 42.7 Bn per 3 months
2007/08 52.4 Bn per 3 months (incr 22.7%)
2008/09 61.9 Bn per 3 months (incr 18.1%)
2009/10 75.4 Bn per 3 months (incr of 21.8%)
(peaked at 107.8Bn in late Oct09 = 2.5x starting value)
compared with -
SPX
2006/07 161.5 Bn per 3 months
2007/08 224.2 Bn per 3 months (incr 38.8%)
2008/09 379.2 Bn per 3 months (incr 69.1%)
2009/10 282.2 Bn per 3 months (decr of 25.5%)
(peaked at 441.7 in late May09 = 2.73x starting value)
Am not sure if the volume peaks are significant markers ... but I'm guessing the 'smart money' left the market in the early peaks.
Add to My Watchlist
What is My Watchlist?


