Gday xjo's
2 Charts of the Volatility Futures Index.
A 2 day, 30min chart and a monthly, 30m chart.
The daily i'm tipping higher, so stocks can go lower. Though the monthly has a gap to fill and if that does get filled should adversely send our markets higher. Lookin like a fun month ahead.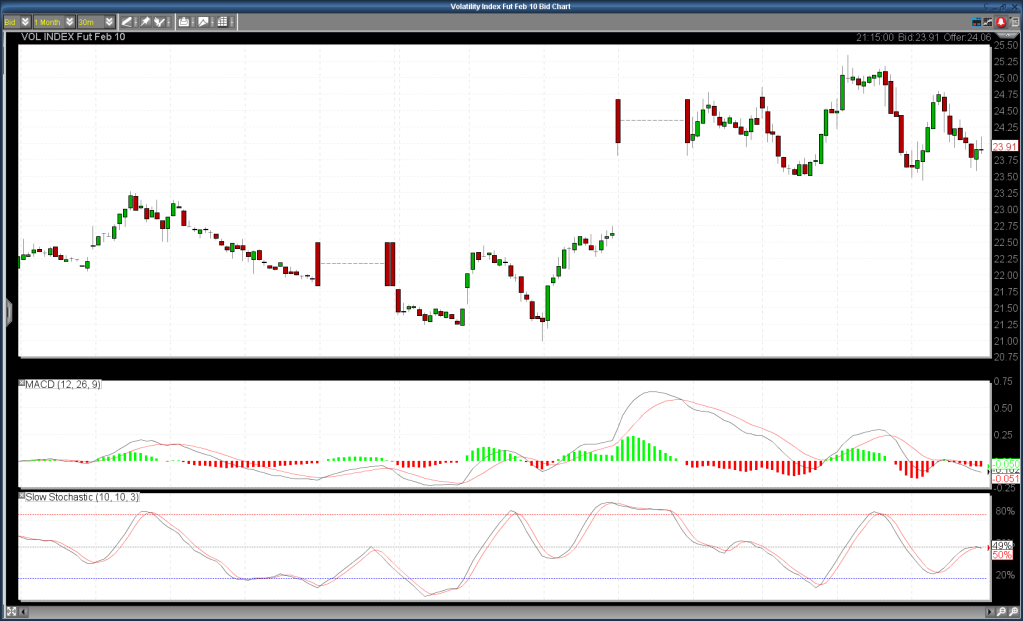
friday thread #2, page-50


Add XJO (ASX) to my watchlist
 (20min delay) (20min delay)
|
|||||
|
Last
8,172.1 |
Change
22.100(0.27%) |
Mkt cap ! n/a | |||
| Open | High | Low |
| 8,150.0 | 8,183.5 | 8,147.5 |
| XJO (ASX) Chart |