Hi Free Will, Volt & Atlunch, yes I take your point. I have a preference for linear charts even over longer timeframes unless we are talking orders of magnitude difference in price when I find log charts start to become useful.
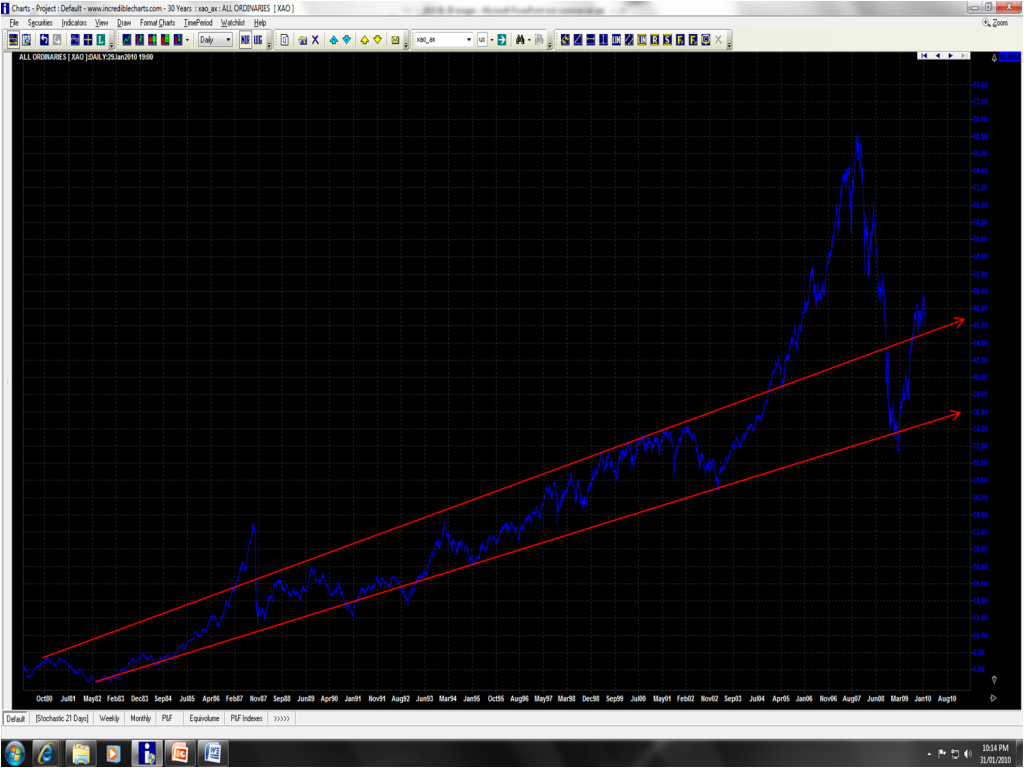
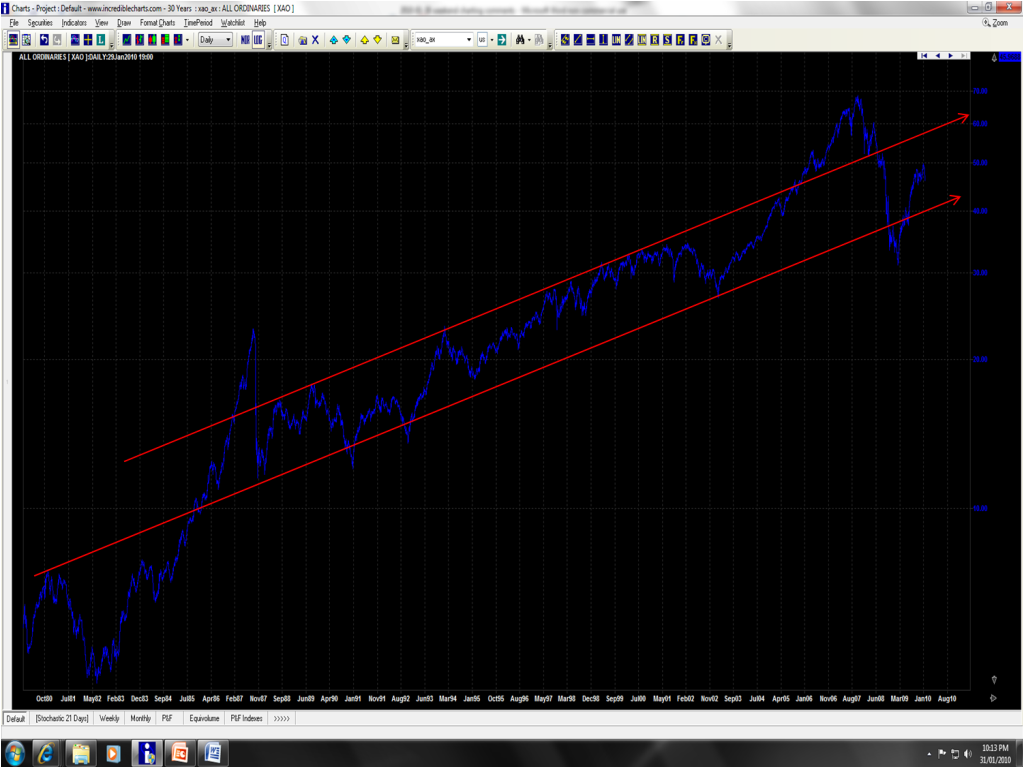
I've re-done that chart in both linear & log scales so the difference can be compared:
Linear price scale (as per previous post):
Log price scale:
The current picture clearly does look different depending on scale used. Using the linear scale the market looks overpiced compared to historical trend, while on log scale it looks fair value. The only rider on this is that "historical" is the trend lines which are formed mainly from the post-87/pre-techwreck bull market rally, which clearly has a different trend path to the post-techwreck rally of 2003-2007.
Whether the market is currently fair value or overpriced and therefore which way it will trend from here is not dependent on price scale used, but on the fundamental question of what will drive the economic growth rate for the next major period, as compared to the bull markets of the 90's and 2003-2007. That is, while growth averaged X% for the 90's bull market and Y% (where Y > X) for 2003-2007, what will be the growth rate for the next major period. There are at least 3 possibilities:
1. If its similar to the 90's rally, then I would say its currently fair value.
2. If it's going to be slower because the US and major economies eventually have to reel in debt, then its going to be overpriced.
3. Conversely if China does manage to sustain 8-10% growth levels, then Australia may get towed along for the ride and we could be undervalued.
Time will tell...
Cheers, Sharks.
Add to My Watchlist
What is My Watchlist?


