Lindfield,
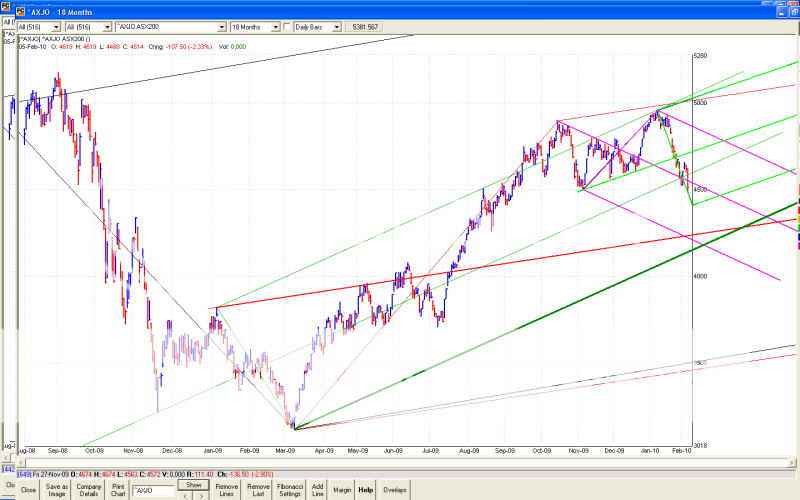
This is the XJO, the way I draw it.
The ascending DARK green fork identifies the Intermediate term trend, framing the rally since last March. The IT trend is not broken till that thick green line is breached, and then back tested as resistance, in my books.
The descending pink fork frames the Short Term trend. Price has just breached the median line again, and is headed for the lower pink line. Before it gets there, it has to overcome the support provide by the "provisional" light green, ascending fork, support tyne. I have estimated the fork's position by using the line of touches on the light green median line.
If it gets lower than light green, then it has to break the red median line. If it gets past that, then there is the thick dark green support tyne. If it breached that, I would then expect it to bounce along the lower pink tyne.
Personally I dont think it will get past red, but I will watch, and trade it as it plays out, just as I am currently doing.
- Forums
- ASX - General
- weekend charting feb 6/7
weekend charting feb 6/7, page-10
Featured News
Featured News
The Watchlist
WCE
WEST COAST SILVER LIMITED
Bruce Garlick, Executive Chairman
Bruce Garlick
Executive Chairman
Previous Video
Next Video
SPONSORED BY The Market Online


