this may help . Its an auto generated chart that i subscribe to. 4 buy and sell signals
yellow shows beginning of up or down trend. red triangle with red circle shows strong downtrend and shows bollingers breaking to downside. I will look for a yellow triangle again for a safe entry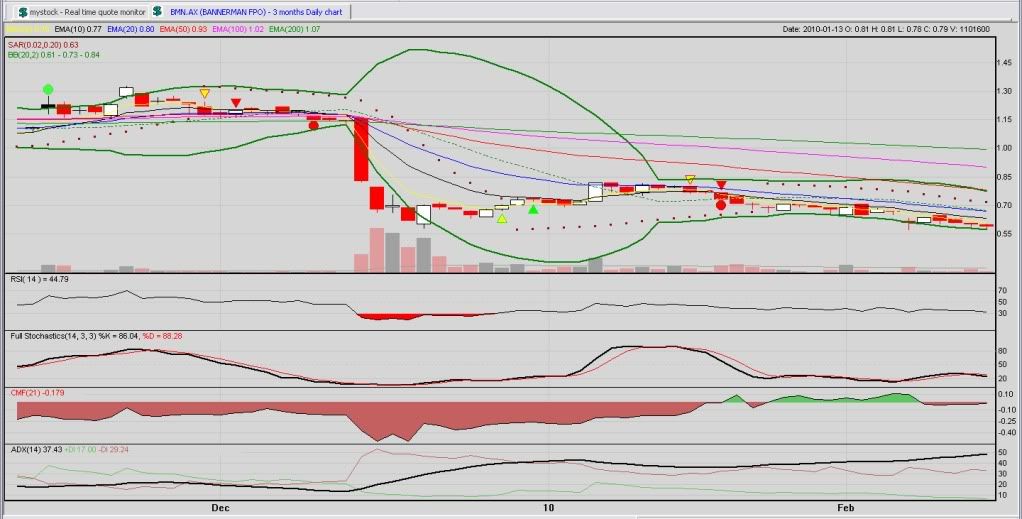


Add to My Watchlist
What is My Watchlist?
 (20min delay) (20min delay)
|
|||||
|
Last
$3.75 |
Change
0.390(11.6%) |
Mkt cap ! $770.2M | |||
| Open | High | Low | Value | Volume |
| $3.59 | $3.89 | $3.59 | $9.620M | 2.564M |
Buyers (Bids)
| No. | Vol. | Price($) |
|---|---|---|
| 1 | 4250 | $3.70 |
Sellers (Offers)
| Price($) | Vol. | No. |
|---|---|---|
| $3.75 | 461 | 1 |
View Market Depth
| Last trade - 16.10pm 16/09/2025 (20 minute delay) ? |
| BMN (ASX) Chart |