hi pa
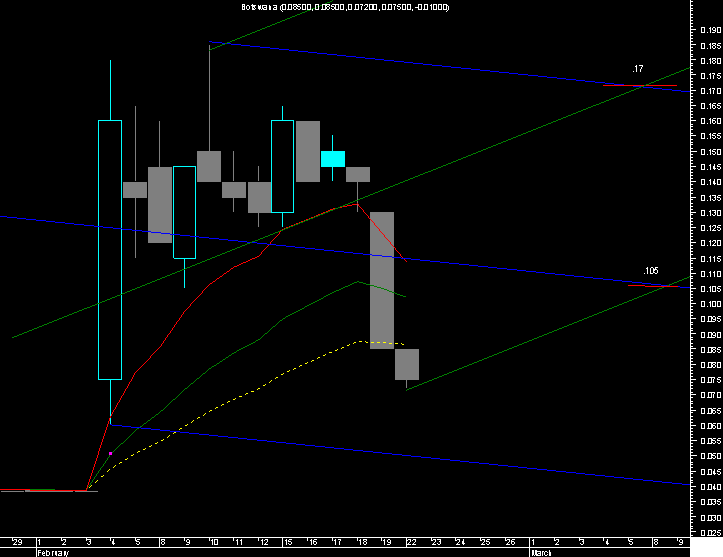
the center line is 50% of the range..the other lines are the action/reaction , the placing of these lines send the medianline into a downward trend, and as you can see price has followed it down..
now i will place a set of andrews in a upward trend and see if today's price follows the upward trend or continues to follow the downward set..
just as a lesson in andrews :-)
also if price follows the green set up i have marked resistance on the chart one at .105 if over that then at .17
hope this helps explain the use of andrews a little
have a great day
ac :-)
- Forums
- ASX - By Stock
- SI6
- botswana drill program progress report
botswana drill program progress report , page-39
-
- There are more pages in this discussion • 10 more messages in this thread...
You’re viewing a single post only. To view the entire thread just sign in or Join Now (FREE)
Featured News
Add SI6 (ASX) to my watchlist
(20min delay)
|
|||||
Last
0.1¢ |
Change
0.000(0.00%) |
Mkt cap ! $2.368M |
Open | High | Low | Value | Volume |
0.1¢ | 0.1¢ | 0.1¢ | $3K | 3M |
Buyers (Bids)
No. | Vol. | Price($) |
---|---|---|
63 | 171708315 | 0.1¢ |
Sellers (Offers)
Price($) | Vol. | No. |
---|---|---|
0.2¢ | 31230977 | 29 |
View Market Depth
No. | Vol. | Price($) |
---|---|---|
58 | 168970810 | 0.001 |
0 | 0 | 0.000 |
0 | 0 | 0.000 |
0 | 0 | 0.000 |
0 | 0 | 0.000 |
Price($) | Vol. | No. |
---|---|---|
0.002 | 26230977 | 28 |
0.003 | 9851752 | 12 |
0.004 | 16255017 | 14 |
0.005 | 10402091 | 13 |
0.006 | 7818176 | 5 |
Last trade - 12.43pm 27/09/2024 (20 minute delay) ? |
Featured News
SI6 (ASX) Chart |